Tijdreeksplots interpreteren
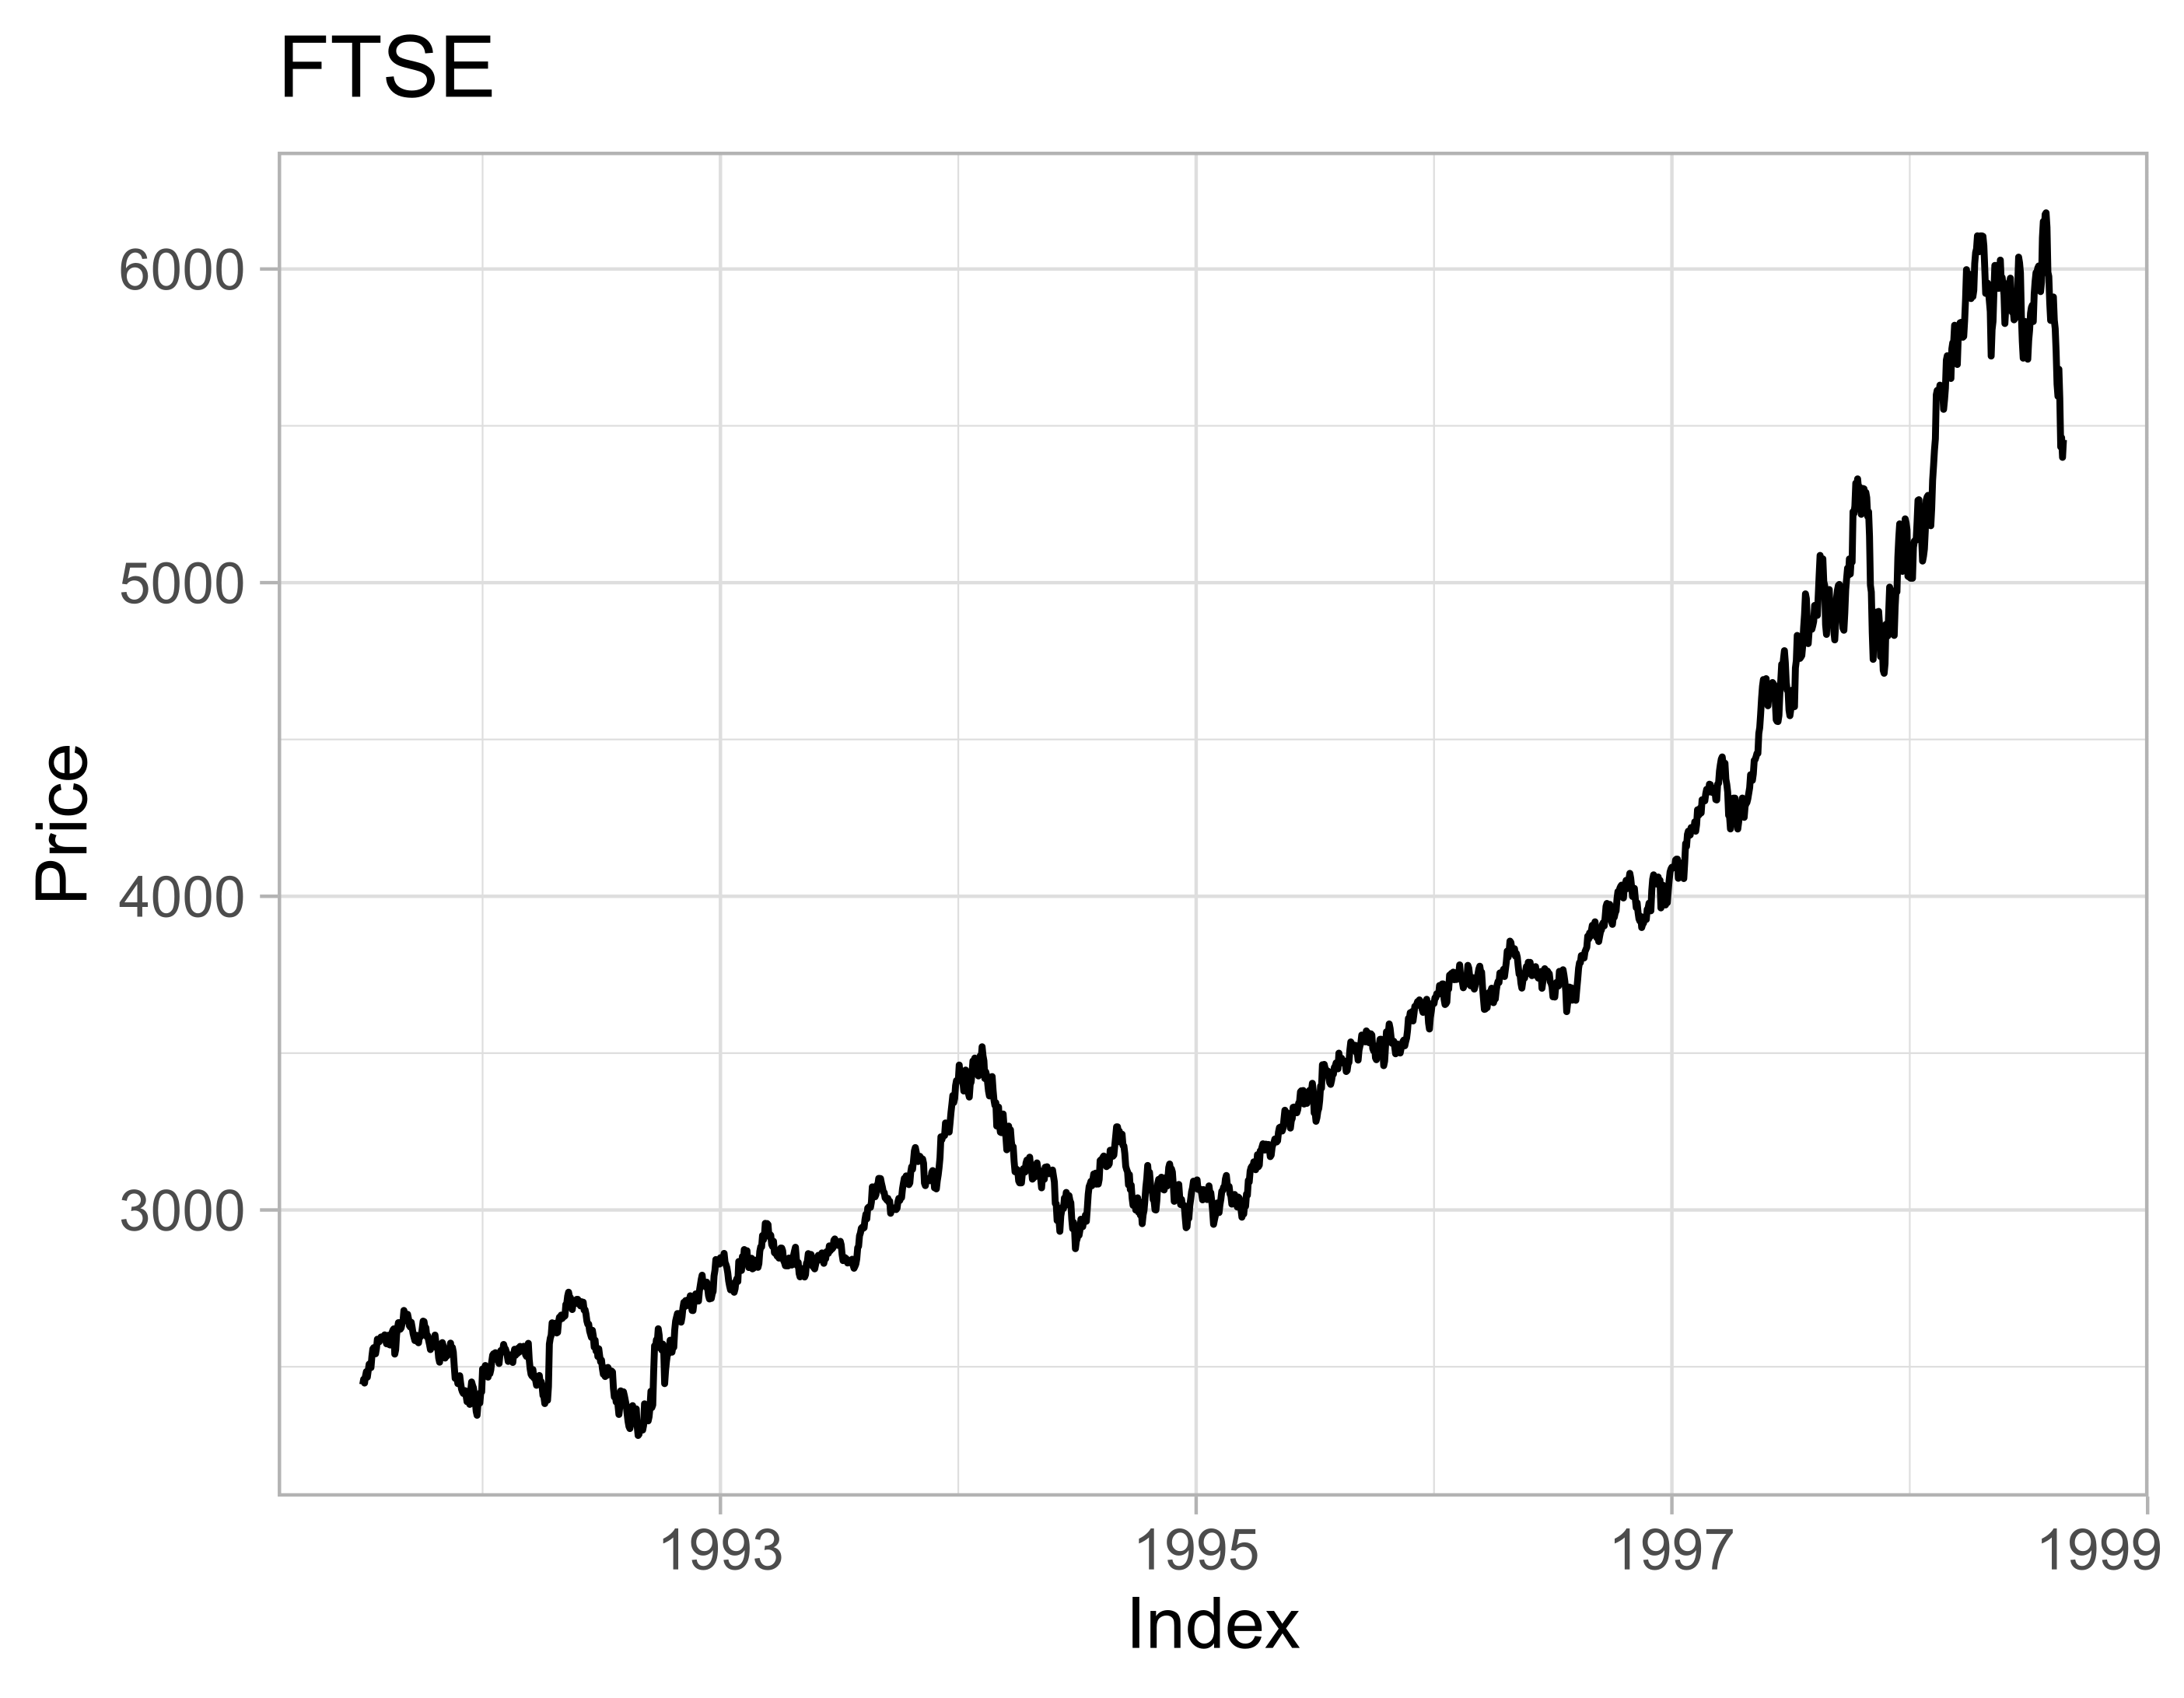
Bij het visualiseren van tijdreeksgegevens is het cruciaal dat je de verschillende kenmerken en eigenschappen van de plots van je gegevens kunt interpreteren. Door eigenschappen uit een plot af te leiden, kun je beter bepalen welke tools je nodig hebt voor je analyse. In deze oefening interpreteer je enkele eigenschappen van de tijdreeks ftse, op basis van de plot.
Deze oefening maakt deel uit van de cursus
Tijdreeksgegevens bewerken in R
Interactieve oefening met praktijkervaring
Zet theorie om in actie met een van onze interactieve oefeningen
 Begin oefening