Seaborns staafdiagrammen verbeteren
De standaardkleuren die Seaborn gebruikt voor staven in een staafdiagram zijn niet ideaal voor een zo nauwkeurig mogelijke waarneming. Door elke staaf een andere kleur te geven, loop je het risico dat de kijker twee even hoge staven als verschillend groot ervaart, omdat mensen sommige kleuren als ‘groter’ zien dan andere.
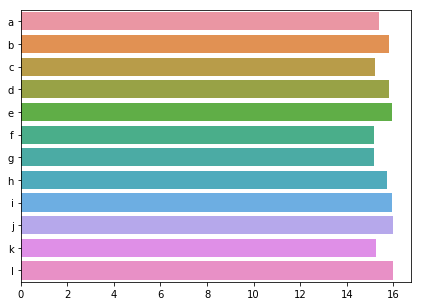
We hebben twee eenvoudige manieren besproken om dit te verbeteren. Ten eerste: zet een rand om de staven. Ten tweede: geef alle staven dezelfde kleur. Probeer beide oplossingen op onze vervuilingsdata.
Deze oefening maakt deel uit van de cursus
Je datavisualisaties verbeteren in Python
Interactieve oefening met praktijkervaring
Probeer deze oefening door deze voorbeeldcode aan te vullen.
import numpy as np

sns.barplot(y = 'city', x = 'CO',
            estimator = np.mean,
            ci = False,
            data = pollution,
            # Add a border to the bars
            ____ = ____)
plt.show()