De variabele leeftijd onderzoeken
Een veelgebruikte manier om een variabele te onderzoeken, is tellen hoe vaak specifieke waarden in de data voorkomen.
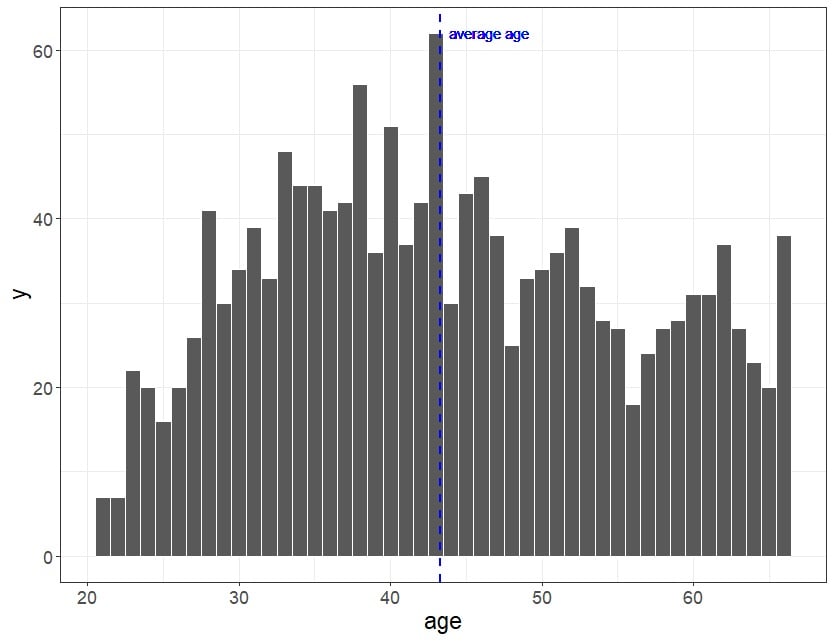
Een histogram laat bijvoorbeeld de aantallen per waarde van de variabele zien. Dat is heel handig om te controleren welke waarden het meest voorkomen en welke ontbreken.
De data scientist in je team heeft het histogram hiernaast voorbereid om je te helpen beoordelen hoe goed verschillende leeftijden in de enquête zijn vertegenwoordigd.
 Welke uitspraken over leeftijd zijn WAAR?
Deze oefening maakt deel uit van de cursus
Data Literacy-casestudy: Analyse van werken op afstand
Interactieve oefening met praktijkervaring
Zet theorie om in actie met een van onze interactieve oefeningen
 Begin oefening