Mass shootings: 출력 수정하기
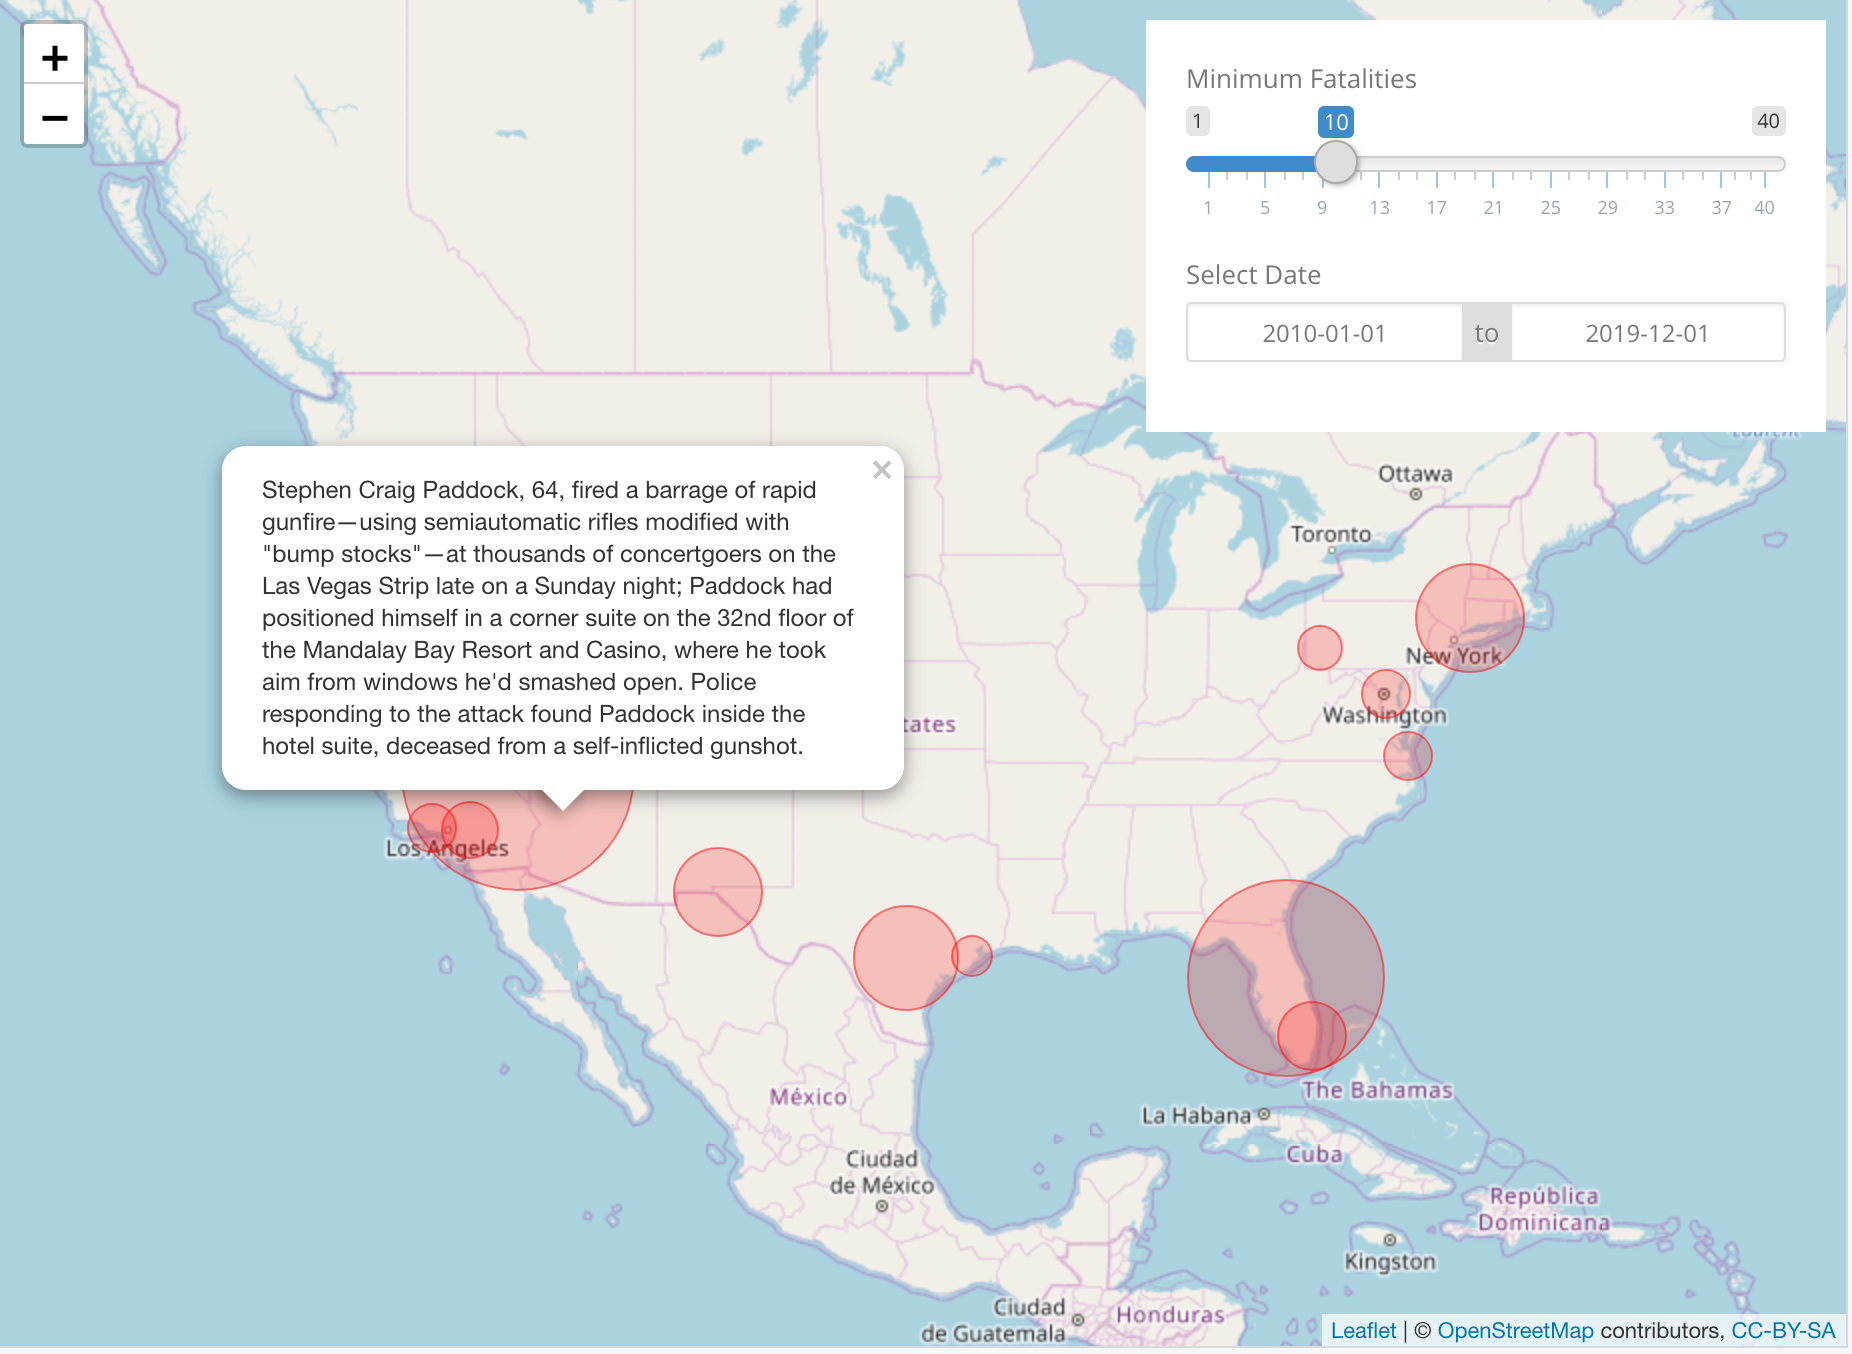
이 연습 문제에서는 이전에 만든 Shiny 앱을 확장해 보세요. 사망자 수에 따라 크기가 달라지는 빨간 원을 대화형 지도에 표시하고, 원을 클릭하면 사건 요약이 함께 나타나도록 합니다. 완성된 앱은 아래 스크린샷과 비슷하게 보일 거예요.
이 연습은 강의의 일부입니다
R로 Shiny 웹 애플리케이션 만들기
연습 안내
- 반응식
rval_mass_shootings를 업데이트해 사용자 선택에 따라 데이터셋이 사망자 수(nb_fatalities)와 날짜 범위(date_range)로 필터링되도록 하세요. addCircleMarkers()내부 코드를 업데이트해 원의radius를fatalities에,popup매개변수를summary에 매핑하세요. 매개변수p를 필드f에 매핑할 때는p = ~ f형식을 사용할 수 있어요.
실습형 인터랙티브 연습
이 예제를 이 샘플 코드를 완성하여 풀어보세요.
ui <- bootstrapPage(
  theme = shinythemes::shinytheme('simplex'),
  leaflet::leafletOutput('map', height = '100%', width = '100%'),
  absolutePanel(top = 10, right = 10, id = 'controls',
    sliderInput('nb_fatalities', 'Minimum Fatalities', 1, 40, 10),
    dateRangeInput('date_range', 'Select Date', "2010-01-01", "2019-12-01")
  ),
  tags$style(type = "text/css", "
    html, body {width:100%;height:100%}
    #controls{background-color:white;padding:20px;}
  ")
)

server <- function(input, output, session) {
  rval_mass_shootings <- reactive({
    # MODIFY CODE BELOW: Filter mass_shootings on nb_fatalities and
    # selected date_range.
    mass_shootings


  })
  output$map <- leaflet::renderLeaflet({
    rval_mass_shootings() %>%
      leaflet() %>%
      addTiles() %>%
      setView( -98.58, 39.82, zoom = 5) %>%
      addTiles() %>%
      addCircleMarkers(
        # CODE BELOW: Add parameters popup and radius and map them
        # to the summary and fatalities columns

        fillColor = 'red', color = 'red', weight = 1
      )
  })
}

shinyApp(ui, server)