요리 탐색: 워드클라우드
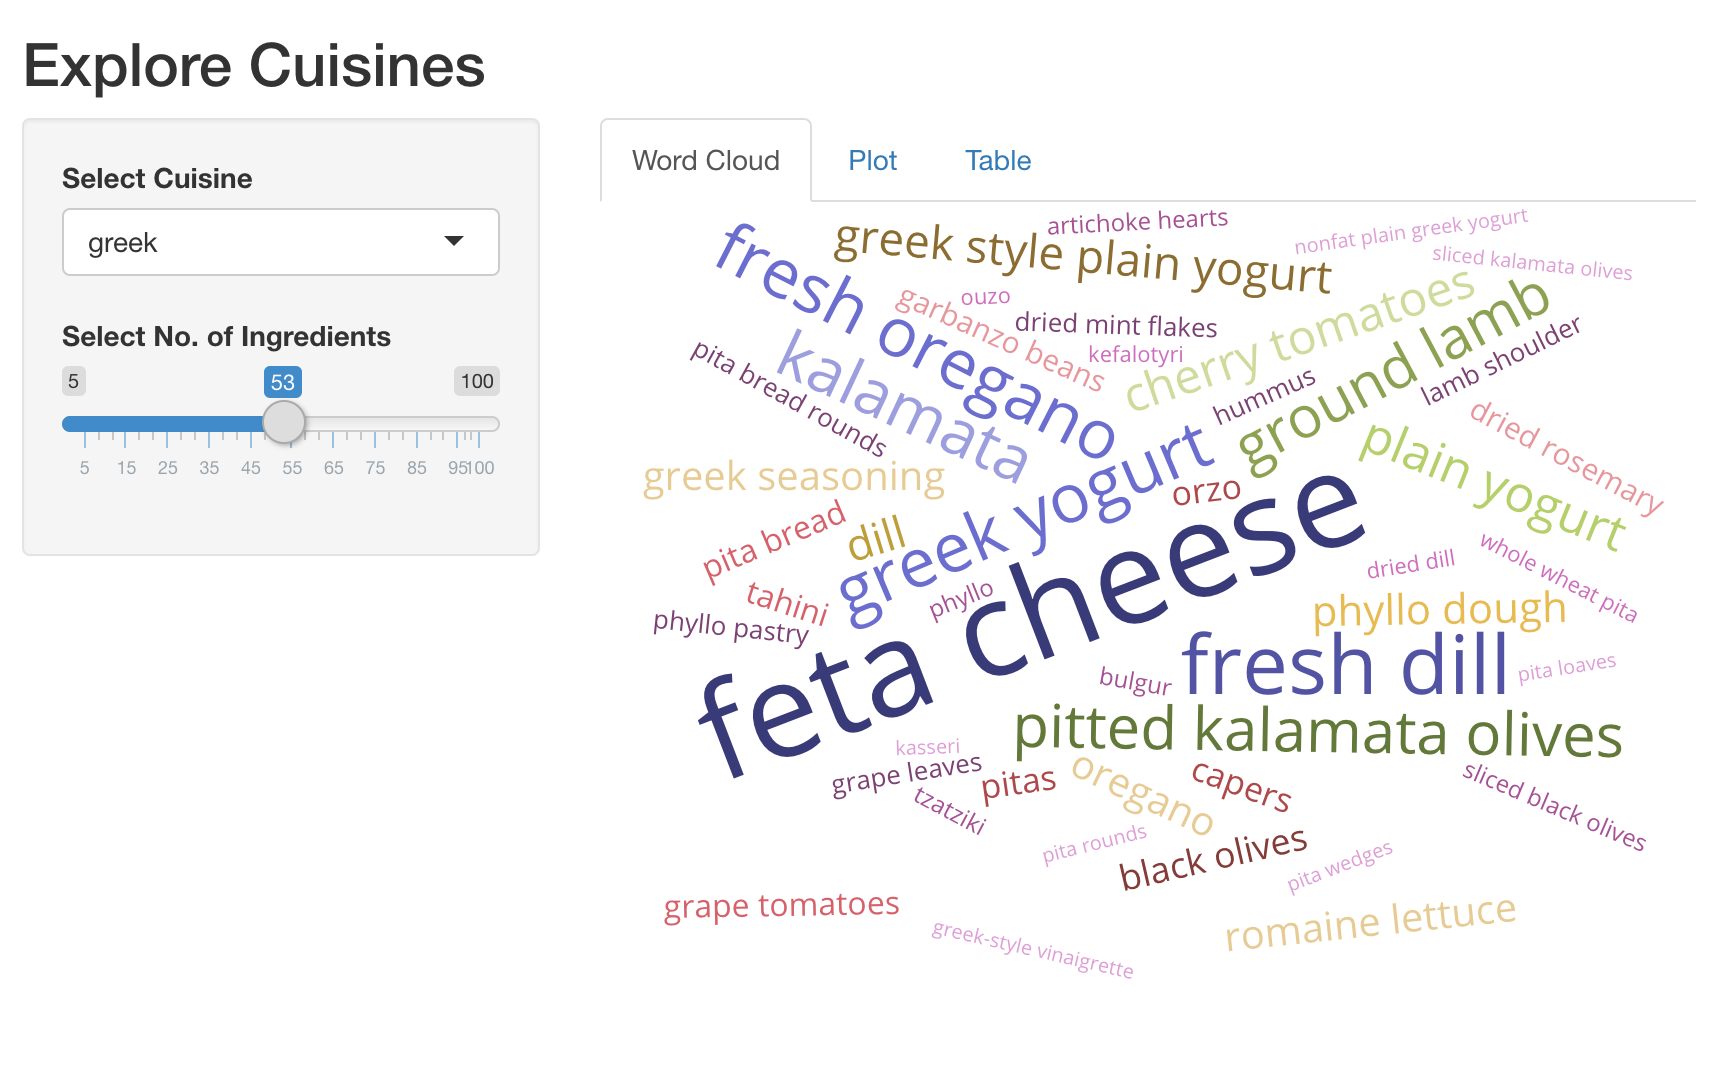
이 음식 관련 Shiny 앱을 만들면서 즐겁게 학습하고 계신가요? 많은 데이터를 한눈에 시각화하는 데에는 워드클라우드가 유용해요. 이번 연습에서는 이전에 만든 Shiny 앱을 확장하여, 가장 특징적인 상위 재료를 상호작용형 워드클라우드로 보여주는 새 탭을 추가해 보겠습니다.
패키지 shiny, dplyr, ggplot2, plotly, d3wordcloud는 이미 불러왔어요.
아래는 워드클라우드를 만드는 간단한 예시입니다.
d3wordcloud(
  words = c('hello', 'world', 'good'),
  freqs = c(20, 40, 30),
  tooltip = TRUE
)
이 연습은 강의의 일부입니다
R로 Shiny 웹 애플리케이션 만들기
연습 안내
- UI:
wc_ingredients라는 이름의d3wordcloudOutput()을 추가하고, 이를tabPanel()로 감싸세요. 이 탭은 앱에서 첫 번째tabPanel()이어야 해요. - Server: 상위 재료와 해당 재료가 사용된 레시피 수를 나타내는 상호작용형 워드클라우드를
d3wordcloud::renderD3wordcloud()로 렌더링하고, 출력 이름wc_ingredients에 할당하세요. 레시피 개수가 포함된 상위 재료 데이터 프레임을 반환하려면 반응식rval_top_ingredients()을(를) 사용해야 합니다.
실습형 인터랙티브 연습
이 예제를 이 샘플 코드를 완성하여 풀어보세요.
ui <- fluidPage(
  titlePanel('Explore Cuisines'),
  sidebarLayout(
    sidebarPanel(
      selectInput('cuisine', 'Select Cuisine', unique(recipes$cuisine)),
      sliderInput('nb_ingredients', 'Select No. of Ingredients', 5, 100, 20),
    ),
    mainPanel(
      tabsetPanel(
        # CODE BELOW: Add `d3wordcloudOutput` named `wc_ingredients` in a `tabPanel`

        tabPanel('Plot', plotly::plotlyOutput('plot_top_ingredients')),
        tabPanel('Table', DT::DTOutput('dt_top_ingredients'))
      )
    )
  )
)

server <- function(input, output, session){
  # CODE BELOW: Render an interactive wordcloud of top ingredients and
  # the number of recipes they get used in, using `d3wordcloud::renderD3wordcloud`,
  # and assign it to an output named `wc_ingredients`.


  rval_top_ingredients <- reactive({
    recipes_enriched %>%
      filter(cuisine == input$cuisine) %>%
      arrange(desc(tf_idf)) %>%
      head(input$nb_ingredients) %>%
      mutate(ingredient = forcats::fct_reorder(ingredient, tf_idf))
  })
  output$plot_top_ingredients <- plotly::renderPlotly({
    rval_top_ingredients() %>%
      ggplot(aes(x = ingredient, y = tf_idf)) +
      geom_col() +
      coord_flip()
  })
  output$dt_top_ingredients <- DT::renderDT({
    recipes %>%
      filter(cuisine == input$cuisine) %>%
      count(ingredient, name = 'nb_recipes') %>%
      arrange(desc(nb_recipes)) %>%
      head(input$nb_ingredients)
  })
}

shinyApp(ui = ui, server= server)