Già?
Immagina il seguente scenario: hai addestrato un modello usando un anno intero di dati etichettati e lo hai messo in produzione.
Un giorno dopo il deploy, decidi di controllare la dashboard di monitoraggio dei dati e vedi l’immagine seguente, dove gli input di training sono in blu e quelli di produzione in arancione.
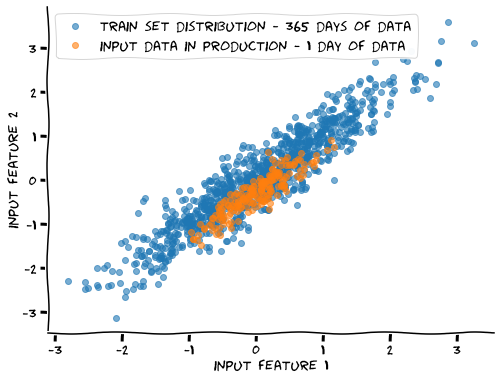
Quale conclusione puoi trarre con certezza?
Questo esercizio fa parte del corso
Deployment e ciclo di vita in MLOps
esercizio interattivo pratico
Trasforma la teoria in pratica con uno dei nostri esercizi interattivi
 Inizia esercizio