Riconoscere la distribuzione normale
La distribuzione normale è molto comune nel mondo reale, ad esempio per il numero di scarpe, l’altezza degli adulti, il peso alla nascita dei neonati e i punteggi di QI; per questo è importante saperla riconoscere quando visualizzi i dati.
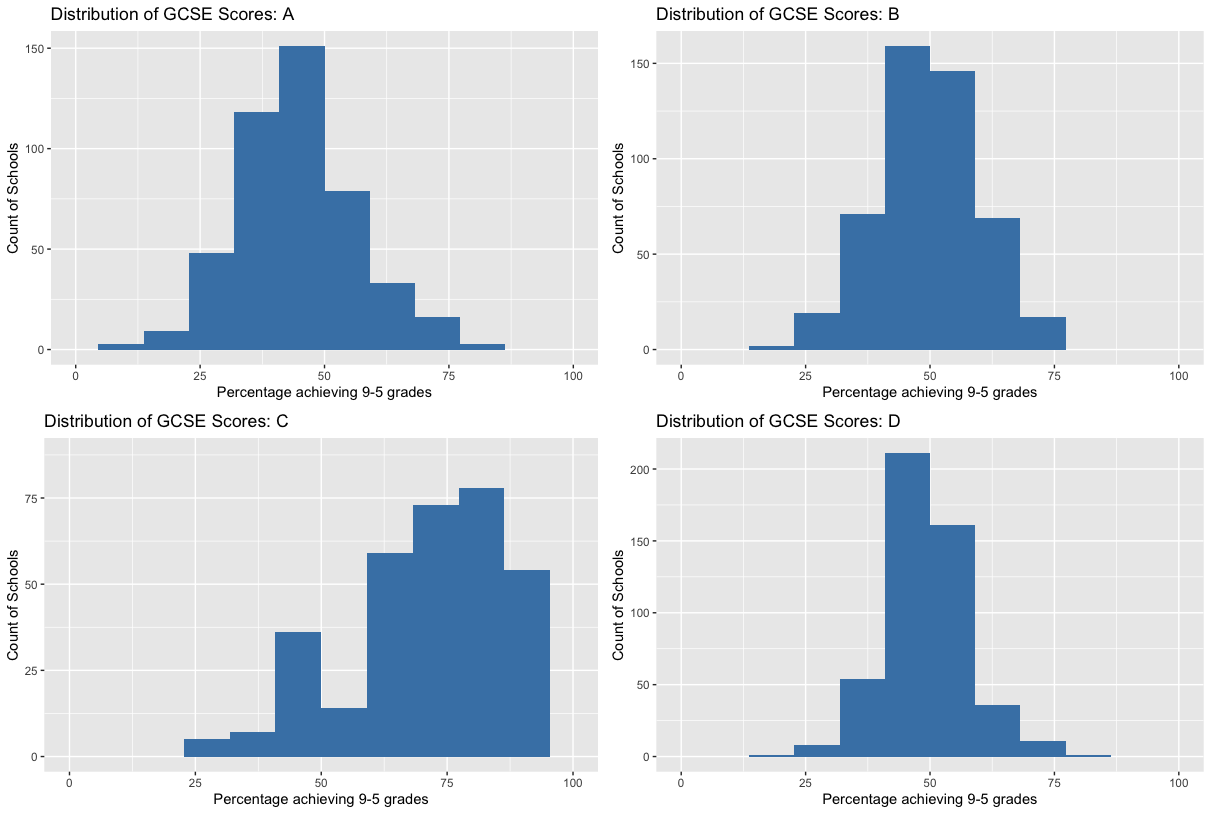
Qui trovi una griglia con quattro grafici che mostrano la distribuzione delle scuole che ottengono varie percentuali di voti di superamento agli esami delle scuole secondarie nel Regno Unito, dove ogni visualizzazione rappresenta studenti di un’etnia diversa.
Il tuo compito è identificare quale di questi grafici non rappresenta una distribuzione normale.
Questo esercizio fa parte del corso
Introduzione alla statistica
Esercizio pratico interattivo
Passa dalla teoria alla pratica con uno dei nostri esercizi interattivi
 Inizia esercizio