Esplora le cucine: word cloud
Speriamo che ti stia divertendo a creare queste Shiny app dedicate al cibo! Un modo pratico per visualizzare una grande quantità di dati sono le word cloud. In questo esercizio estenderai la Shiny app creata in precedenza aggiungendo una nuova scheda che mostra gli ingredienti più caratteristici come word cloud interattiva.
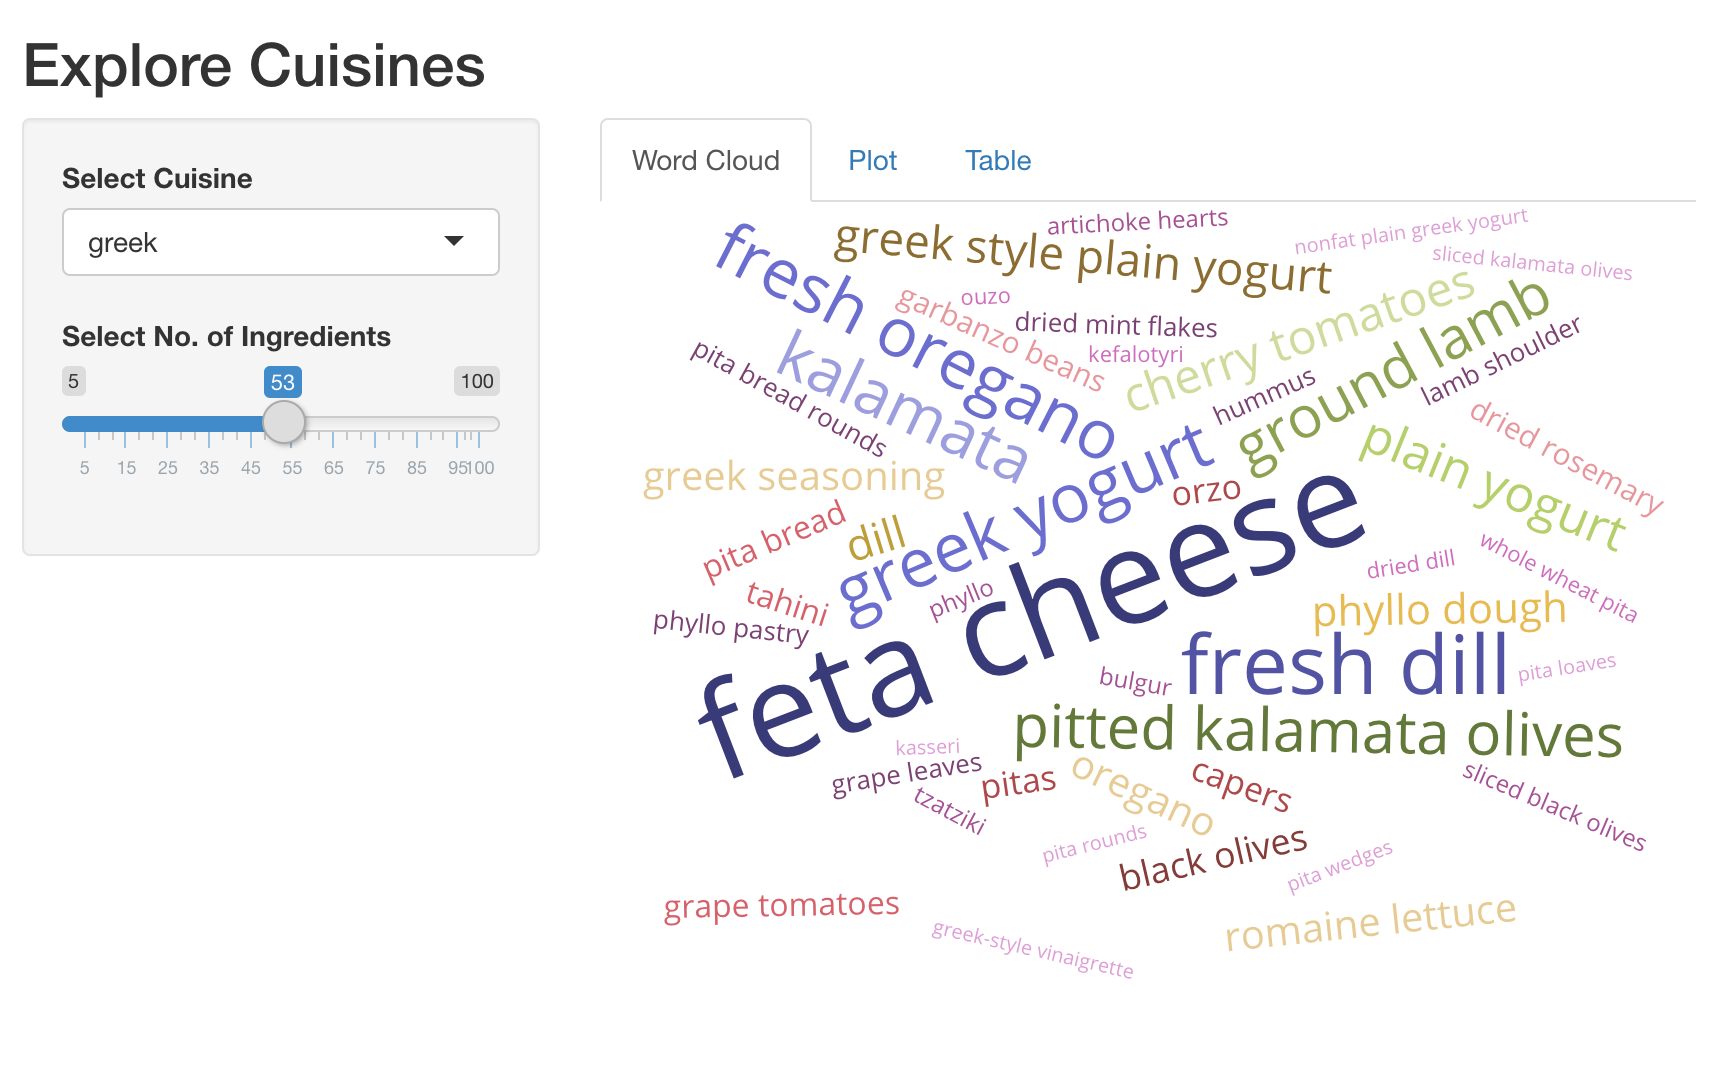
Abbiamo già caricato i pacchetti shiny, dplyr, ggplot2, plotly e
d3wordcloud. Ecco uno snippet utile per creare una word cloud.
d3wordcloud(
  words = c('hello', 'world', 'good'),
  freqs = c(20, 40, 30),
  tooltip = TRUE
)
Questo esercizio fa parte del corso
Creare applicazioni web con Shiny in R
Istruzioni dell'esercizio
- UI: Aggiungi un
d3wordcloudOutput()chiamatowc_ingredientse racchiudilo in untabPanel(). Questo deve essere il primotabPanel()della tua app. - Server: Genera una word cloud interattiva degli ingredienti principali e
del numero di ricette in cui vengono usati, usando
d3wordcloud::renderD3wordcloud()e assegnandola a un output chiamatowc_ingredients. Dovrai usare l'espressione reattivarval_top_ingredients()per restituire un data frame degli ingredienti principali con i conteggi delle ricette.
esercizio interattivo pratico
Prova questo esercizio completando questo codice di esempio.
ui <- fluidPage(
  titlePanel('Explore Cuisines'),
  sidebarLayout(
    sidebarPanel(
      selectInput('cuisine', 'Select Cuisine', unique(recipes$cuisine)),
      sliderInput('nb_ingredients', 'Select No. of Ingredients', 5, 100, 20),
    ),
    mainPanel(
      tabsetPanel(
        # CODE BELOW: Add `d3wordcloudOutput` named `wc_ingredients` in a `tabPanel`

        tabPanel('Plot', plotly::plotlyOutput('plot_top_ingredients')),
        tabPanel('Table', DT::DTOutput('dt_top_ingredients'))
      )
    )
  )
)

server <- function(input, output, session){
  # CODE BELOW: Render an interactive wordcloud of top ingredients and
  # the number of recipes they get used in, using `d3wordcloud::renderD3wordcloud`,
  # and assign it to an output named `wc_ingredients`.


  rval_top_ingredients <- reactive({
    recipes_enriched %>%
      filter(cuisine == input$cuisine) %>%
      arrange(desc(tf_idf)) %>%
      head(input$nb_ingredients) %>%
      mutate(ingredient = forcats::fct_reorder(ingredient, tf_idf))
  })
  output$plot_top_ingredients <- plotly::renderPlotly({
    rval_top_ingredients() %>%
      ggplot(aes(x = ingredient, y = tf_idf)) +
      geom_col() +
      coord_flip()
  })
  output$dt_top_ingredients <- DT::renderDT({
    recipes %>%
      filter(cuisine == input$cuisine) %>%
      count(ingredient, name = 'nb_recipes') %>%
      arrange(desc(nb_recipes)) %>%
      head(input$nb_ingredients)
  })
}

shinyApp(ui = ui, server= server)