Scale-location
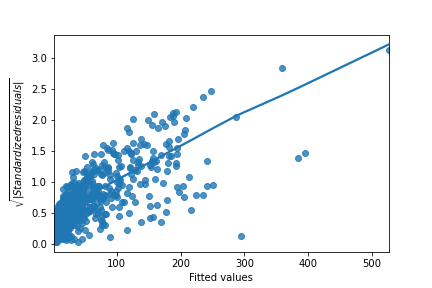
Here are normal scale-location plots of the previous two models. That is, they show the size of residuals versus fitted values.
Original model (n_clicks versus n_impressions):
Transformed model (n_clicks ** 0.25 versus n_impressions ** 0.25):
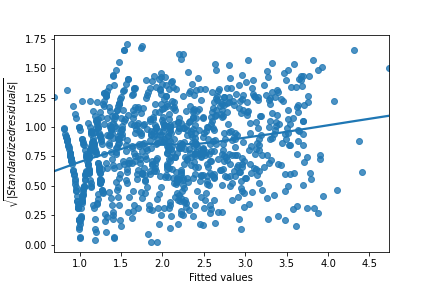
Look at the numbers on the y-axis and the slope of the trend line. Which statement is true?
Latihan ini adalah bagian dari kursus
Introduction to Regression with statsmodels in Python
Latihan interaktif praktis
Ubah teori menjadi tindakan dengan salah satu latihan interaktif kami.
 Mulai berolahraga