Q-Q plot of residuals
Here are normal Q-Q plots of the previous two models.
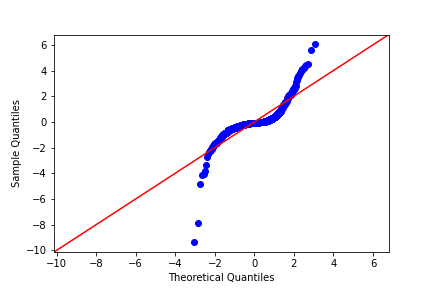
Original model (n_clicks versus n_impressions):
Transformed model (n_clicks ** 0.25 versus n_impressions ** 0.25):
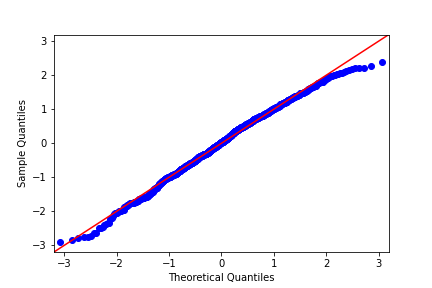
Look at how well the points track the "normality" line. Which statement is true?
Latihan ini adalah bagian dari kursus
Introduction to Regression with statsmodels in Python
Latihan interaktif praktis
Ubah teori menjadi tindakan dengan salah satu latihan interaktif kami.
 Mulai berolahraga