Menyelidiki variabel umur
Cara umum untuk menyelidiki suatu variabel adalah menghitung berapa kali nilai tertentu muncul dalam data.
Histogram, misalnya, menampilkan jumlah untuk setiap nilai variabel. Ini sangat membantu untuk memeriksa nilai mana yang paling umum atau nilai mana yang tidak ada.
Data scientist di tim Anda telah menyiapkan histogram yang Anda lihat di sini untuk membantu Anda mengevaluasi seberapa baik berbagai rentang usia terwakili dalam survei.
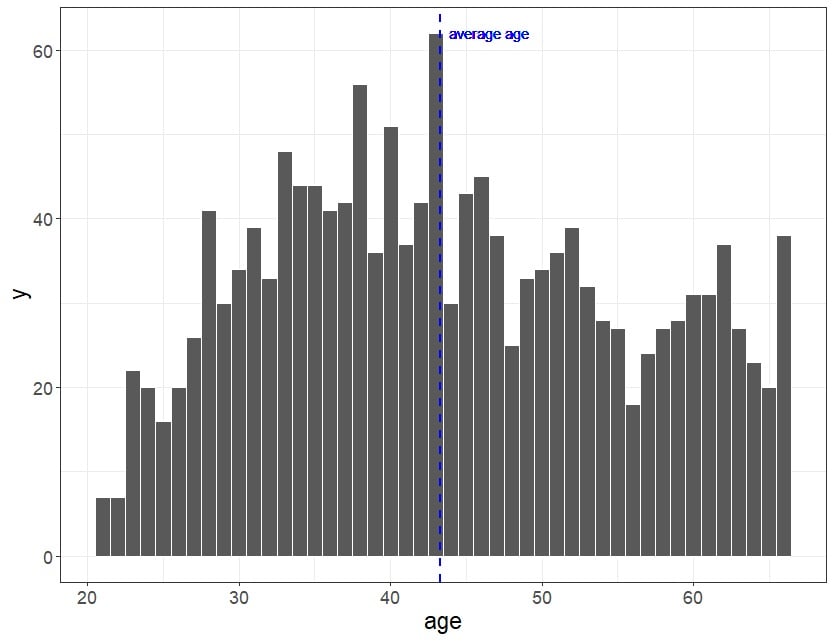 Pernyataan mana tentang umur yang BENAR?
Latihan ini merupakan bagian dari kursus
Studi Kasus Literasi Data: Analisis Kerja Jarak Jauh
Latihan interaktif langsung
Ubah teori menjadi aksi dengan salah satu latihan interaktif kami
 Mulai latihan