Interpréter des histogrammes
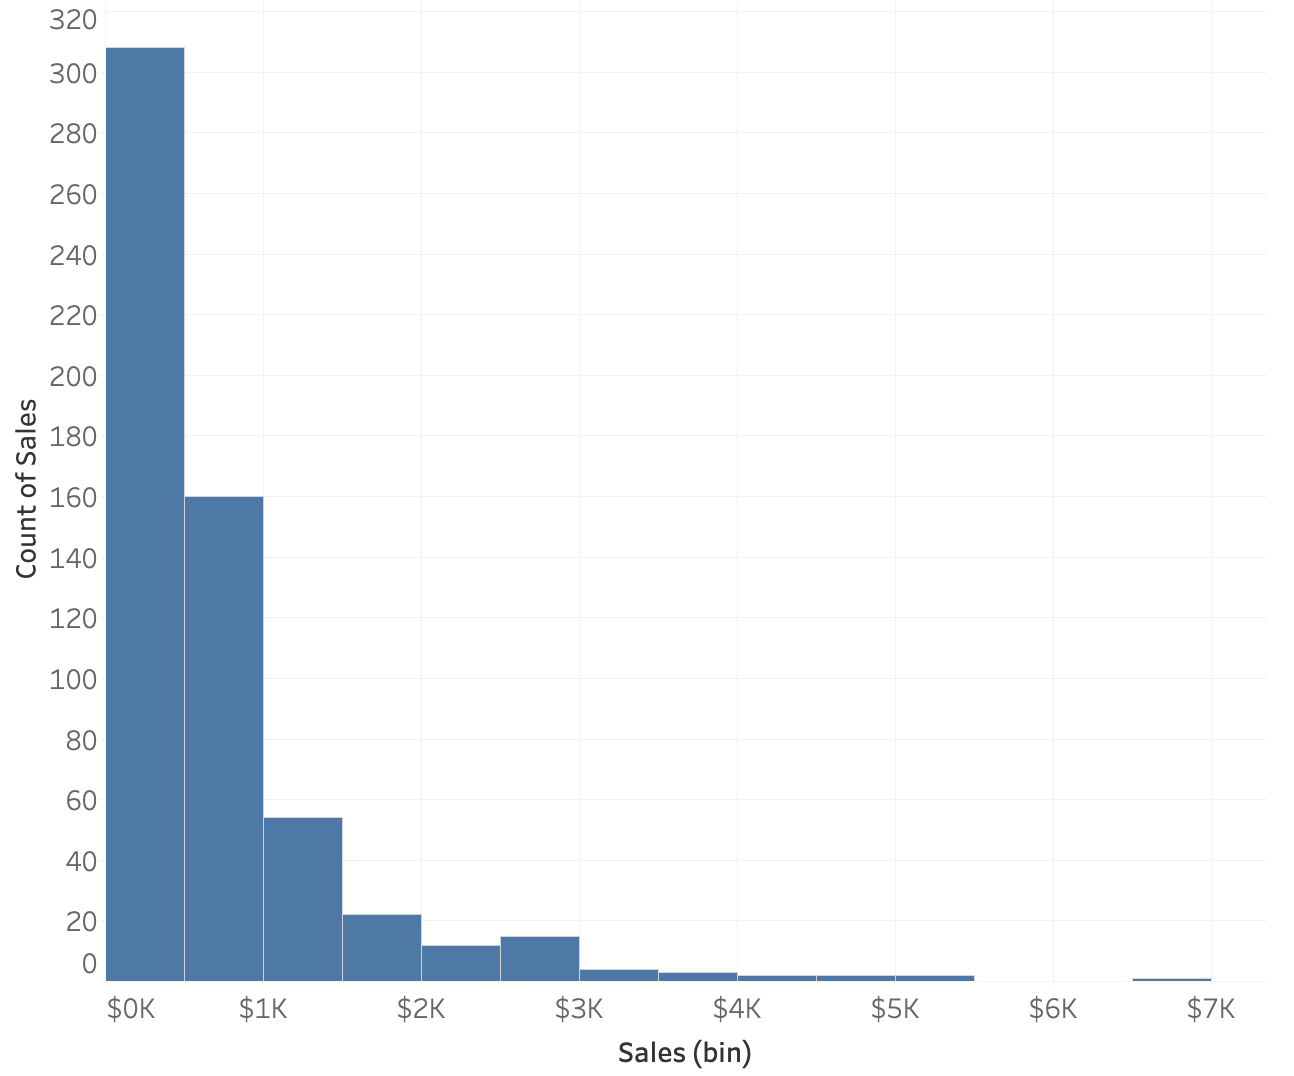
Voici un histogramme des ventes des commandes de fournitures de bureau. Chaque ligne du jeu de données correspond à une commande, donc chaque commande a une seule valeur de vente.
Astuce : Le panneau de gauche de l’exercice, qui contient le texte et les instructions, est redimensionnable. Si le graphique est trop petit, vous pouvez faire glisser pour l’agrandir.
Cet exercice fait partie du cours
<cours>Techniques statistiques dans Tableau</cours>Exercice interactif pratique
Transformez la théorie en action avec l’un de nos exercices interactifs
 Commencer l’exercice