Interpréter des graphiques de séries temporelles
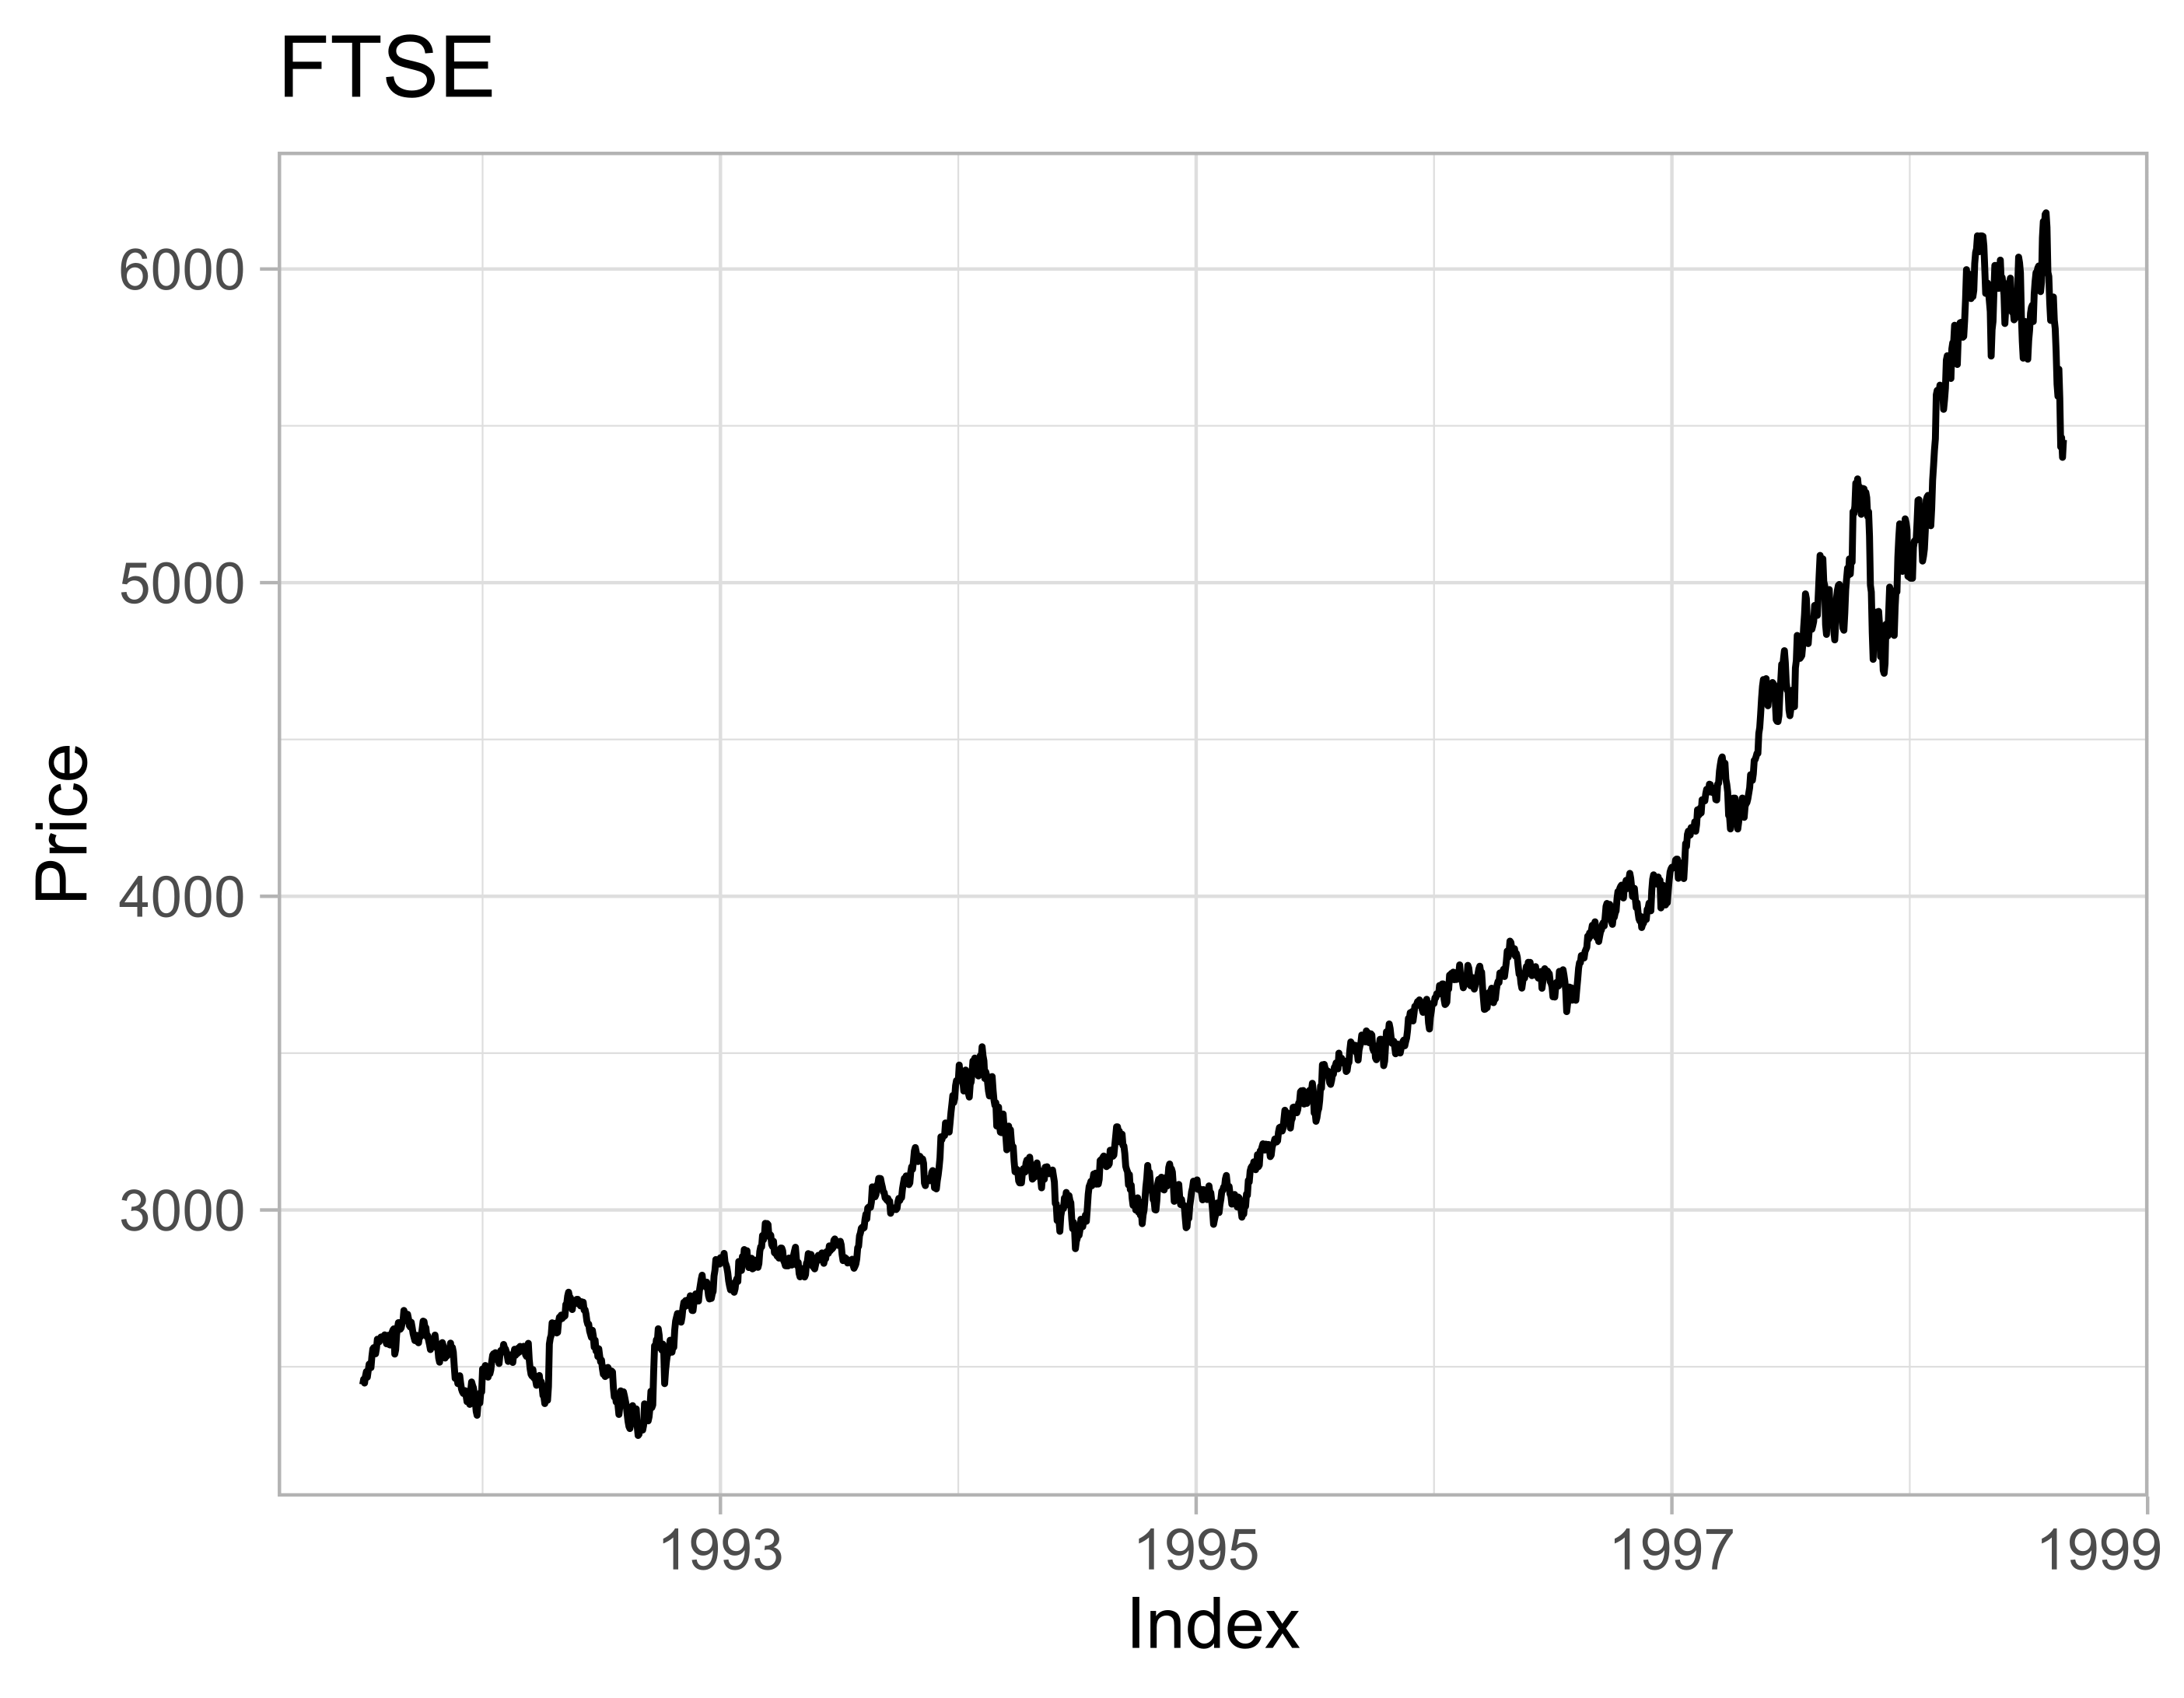
Lorsque vous visualisez des données de séries temporelles, il est essentiel de savoir interpréter les différentes caractéristiques et attributs des graphiques. Déterminer les propriétés de vos données à partir d’un graphique vous permet de mieux préparer les outils nécessaires à votre analyse. Dans cet exercice, vous allez interpréter certaines propriétés de la série temporelle ftse, à partir de son graphique.
Cet exercice fait partie du cours
<cours>Manipuler des séries temporelles en R</cours>Exercice interactif pratique
Transformez la théorie en action avec l’un de nos exercices interactifs
 Commencer l’exercice