La datavisualisation en action
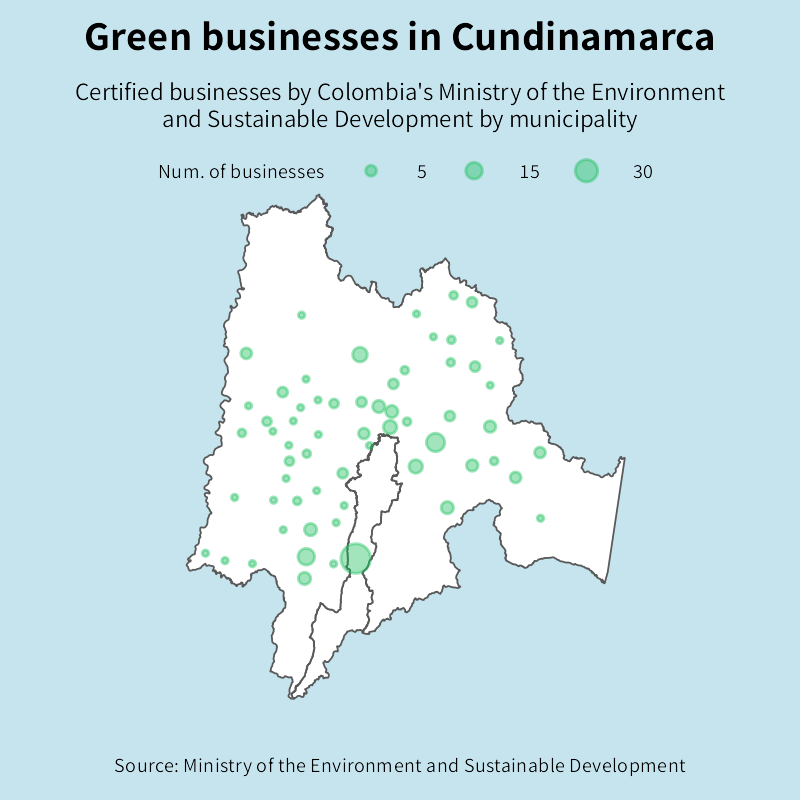
Le graphique suivant montre le nombre d’entreprises vertes certifiées par municipalité en Cundinamarca, l’un des départements de Colombie.
Les départements sont des divisions administratives en Colombie. Pour les besoins de ce cours, pensez-les comme les États aux États-Unis.
Cet exercice fait partie du cours
<cours>Étude de cas : Data storytelling sur les entreprises vertes</cours>Exercice interactif pratique
Transformez la théorie en action avec l’un de nos exercices interactifs
 Commencer l’exercice