Moins, c’est parfois mieux
Parfois, moins, c’est mieux en data storytelling.
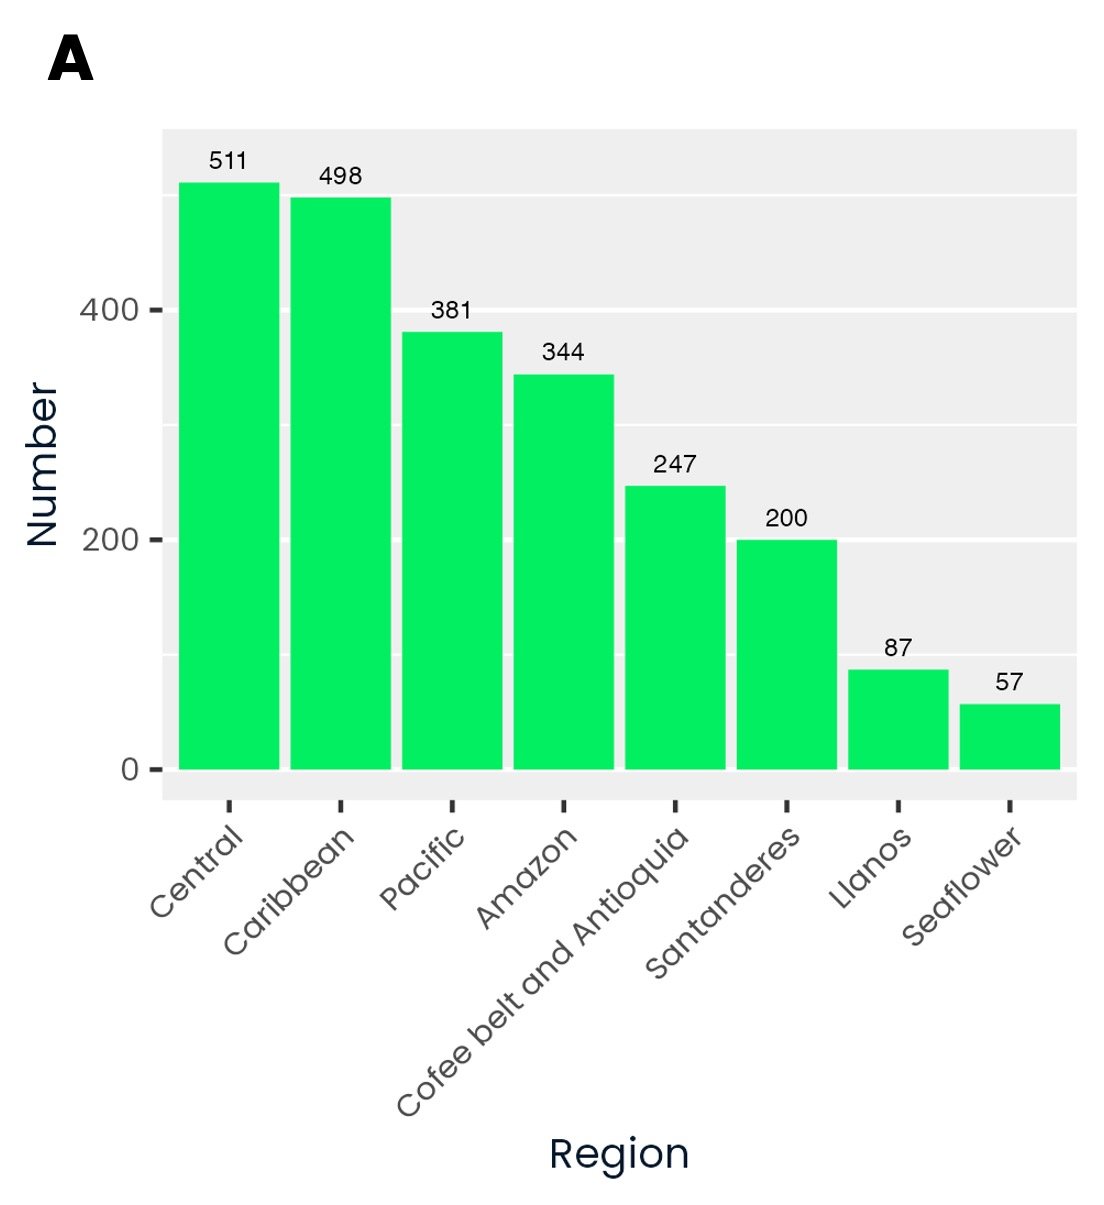
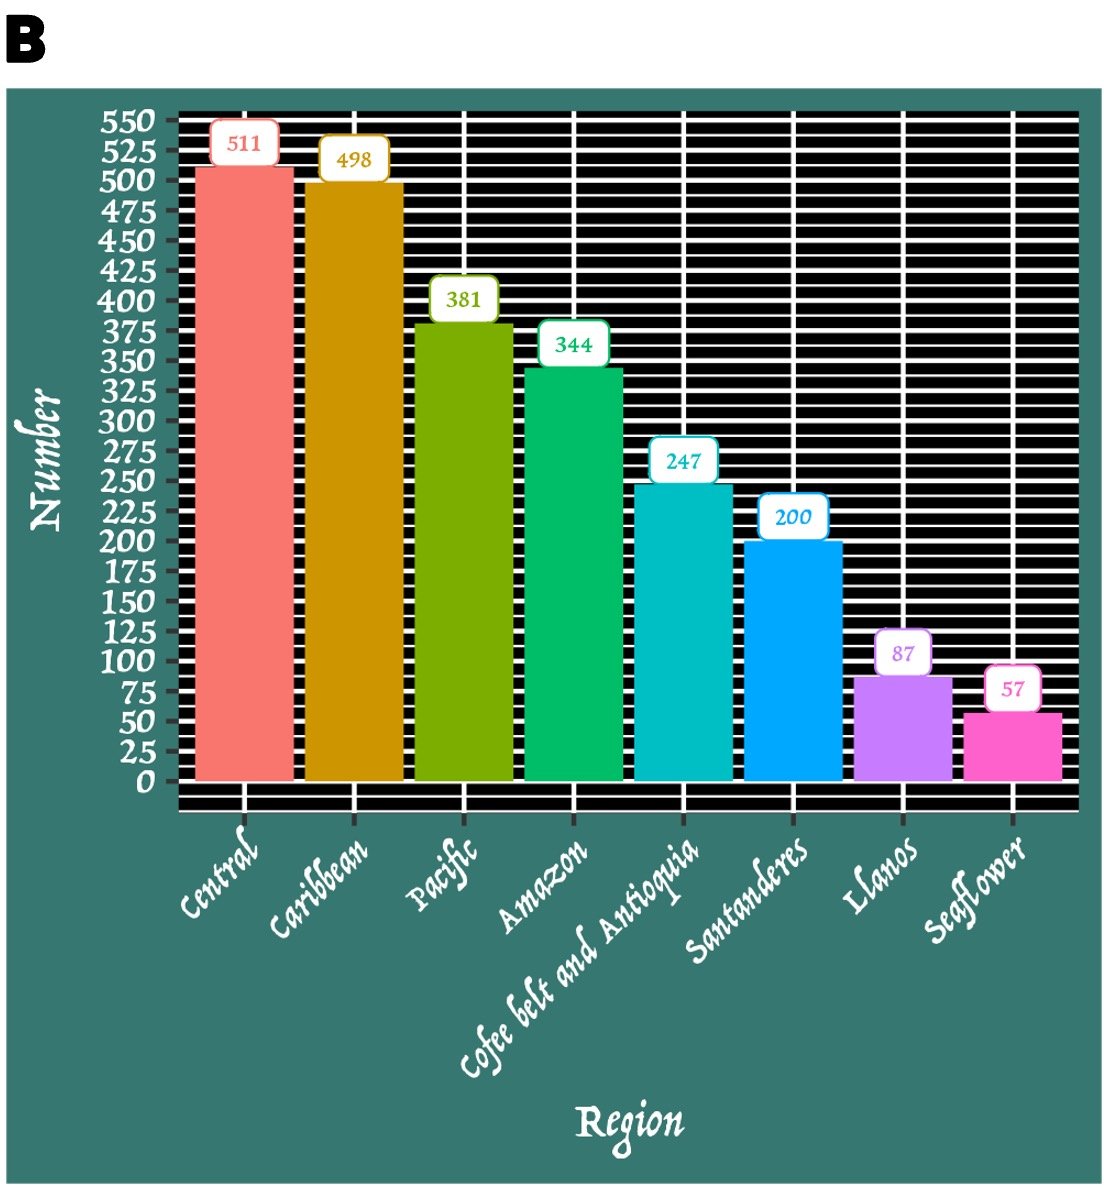
Trop d’informations peuvent compliquer la compréhension de l’histoire que vous racontez. Nous verrons de bonnes pratiques pour créer des graphiques dans les exercices suivants.
Pour l’instant, examinez ces graphiques et sélectionnez l’option INCORRECTE parmi celles-ci.
Cet exercice fait partie du cours
<cours>Étude de cas : Data storytelling sur les entreprises vertes</cours>Exercice interactif pratique
Transformez la théorie en action avec l’un de nos exercices interactifs
 Commencer l’exercice