Usage de la couleur
La couleur est l’un des attributs les plus utilisés en visualisation de données.
Ce n’est pas un hasard si de nombreuses organisations disposent de guides précisant les normes d’utilisation des couleurs, à la fois pour respecter leur identité visuelle et pour des raisons d’accessibilité.
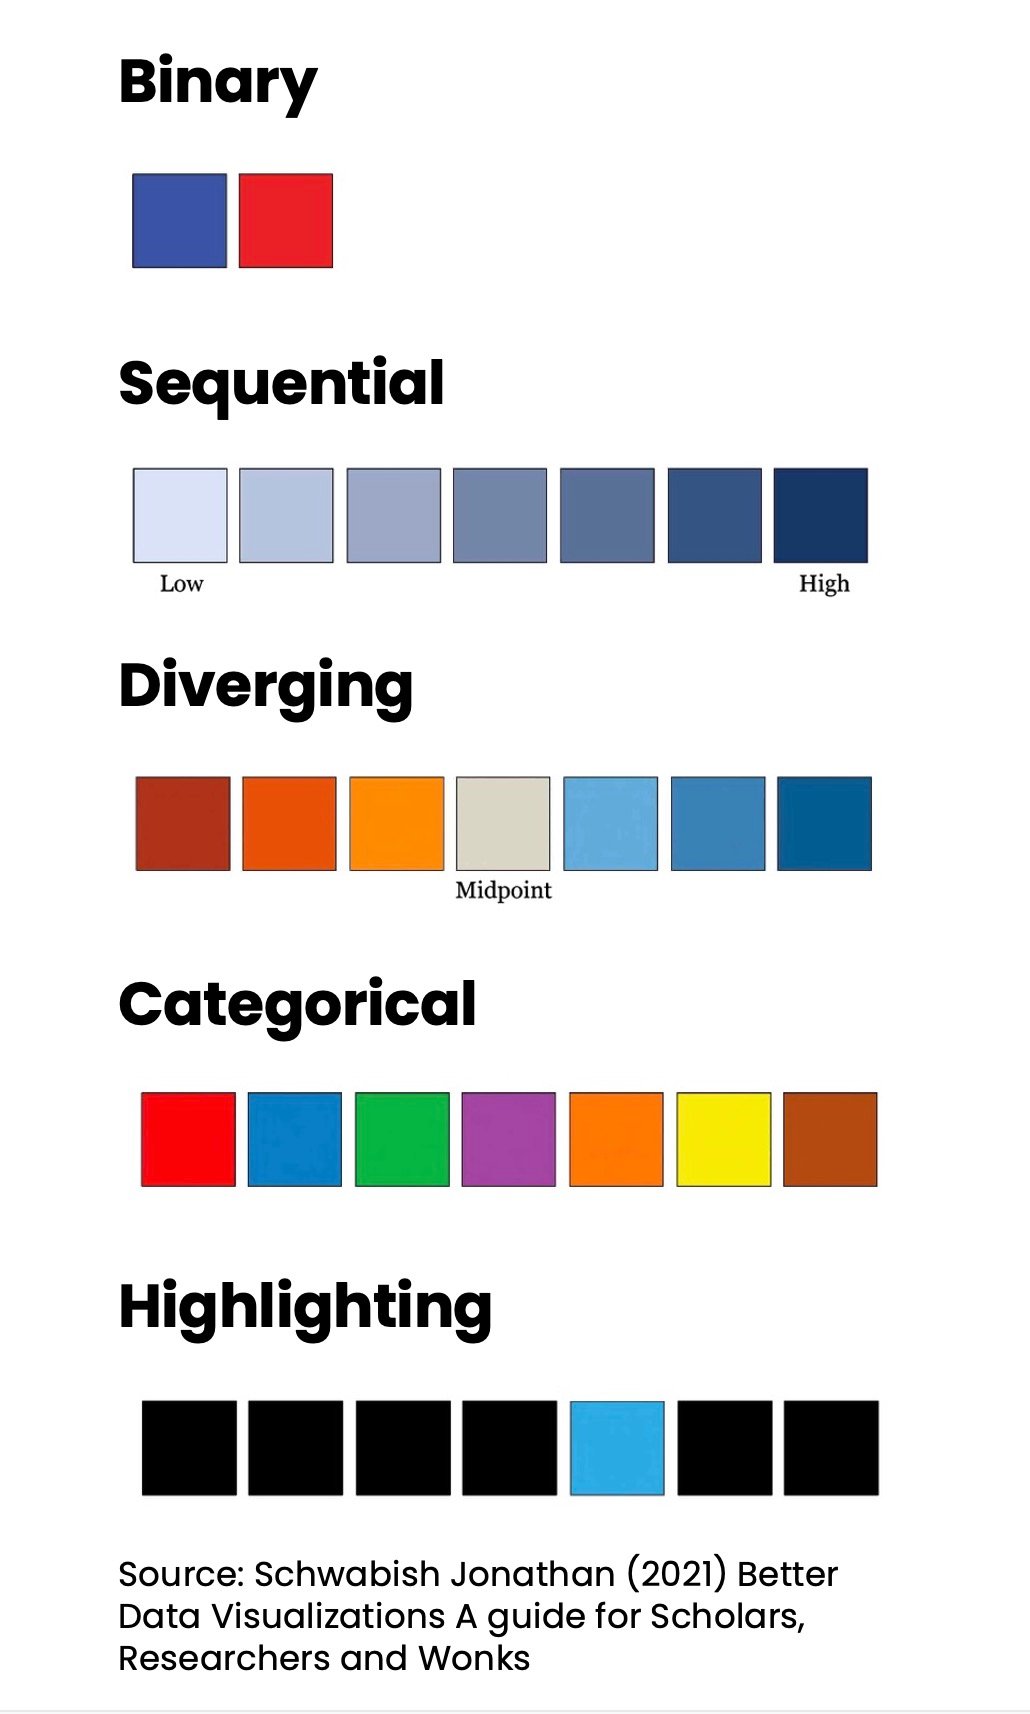
Cinq grands types de palettes de couleurs peuvent être appliqués à vos visualisations :
Cet exercice fait partie du cours
<cours>Étude de cas : Data storytelling sur les entreprises vertes</cours>Exercice interactif pratique
Transformez la théorie en action avec l’un de nos exercices interactifs
 Commencer l’exercice