Sidebar layouts
Layout functions allow inputs and outputs to be visually arranged in the UI. A well-chosen layout makes a Shiny app aesthetically more appealing, and also improves the user experience.
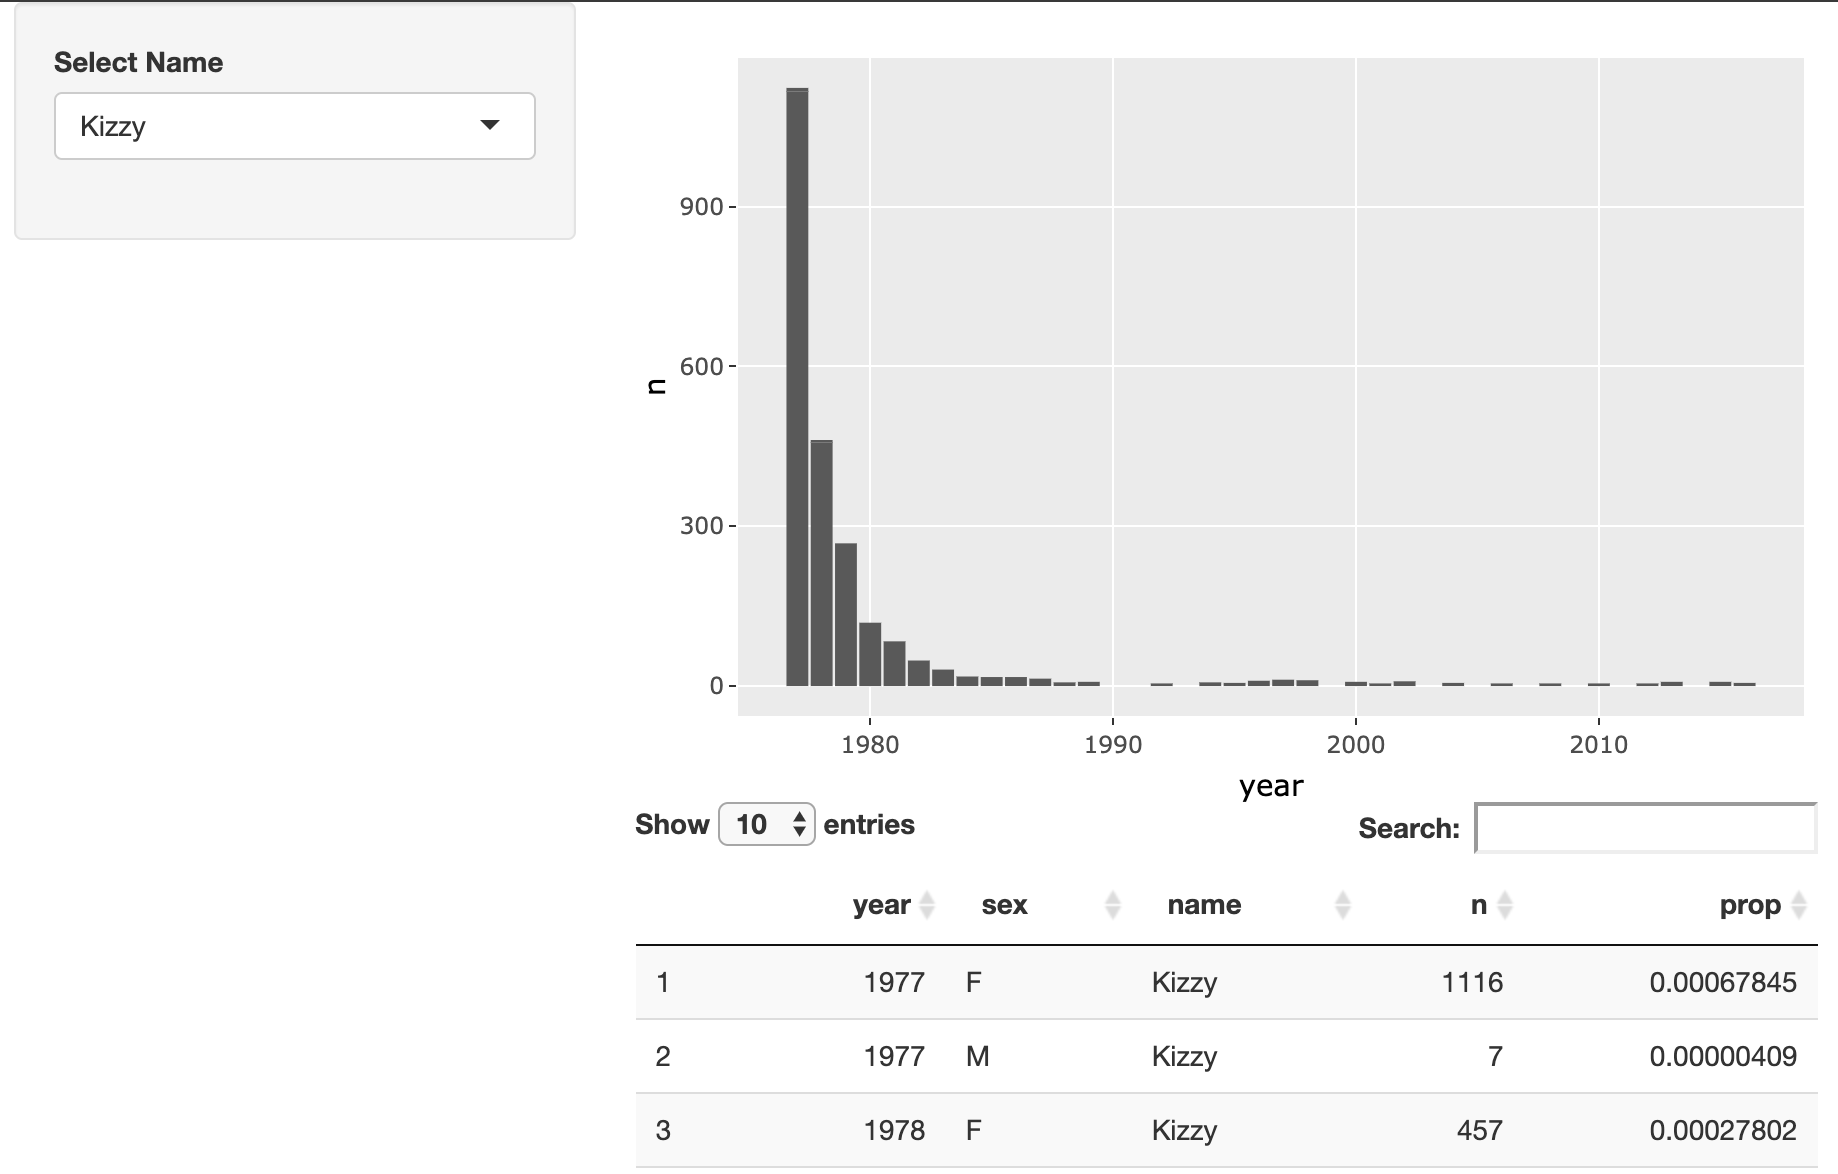
In this exercise, you will modify the layout of a Shiny app that lets users explore the popularity of trendy names. Your final app should visually resemble this:
Cet exercice fait partie du cours
<cours>Building Web Applications with Shiny in R</cours>Instructions de l’exercice
- Modify the layout of this app so that the name selector appears in the sidebar and the plot and table appear on the right.
Exercice interactif pratique
Essayez cet exercice en complétant ce code d’exemple.
ui <- fluidPage(
  # MODIFY CODE BELOW: Wrap in a sidebarLayout
    # MODIFY CODE BELOW: Wrap in a sidebarPanel
    selectInput('name', 'Select Name', top_trendy_names$name),
    # MODIFY CODE BELOW: Wrap in a mainPanel
    plotly::plotlyOutput('plot_trendy_names'),
    DT::DTOutput('table_trendy_names')
)

# DO NOT MODIFY
server <- function(input, output, session){
  # Function to plot trends in a name
  plot_trends <- function(){
     babynames %>%
      filter(name == input$name) %>%
      ggplot(aes(x = year, y = n)) +
      geom_col()
  }
  output$plot_trendy_names <- plotly::renderPlotly({
    plot_trends()
  })

  output$table_trendy_names <- DT::renderDT({
    babynames %>%
      filter(name == input$name)
  })
}

shinyApp(ui = ui, server = server)