Interpreting histograms
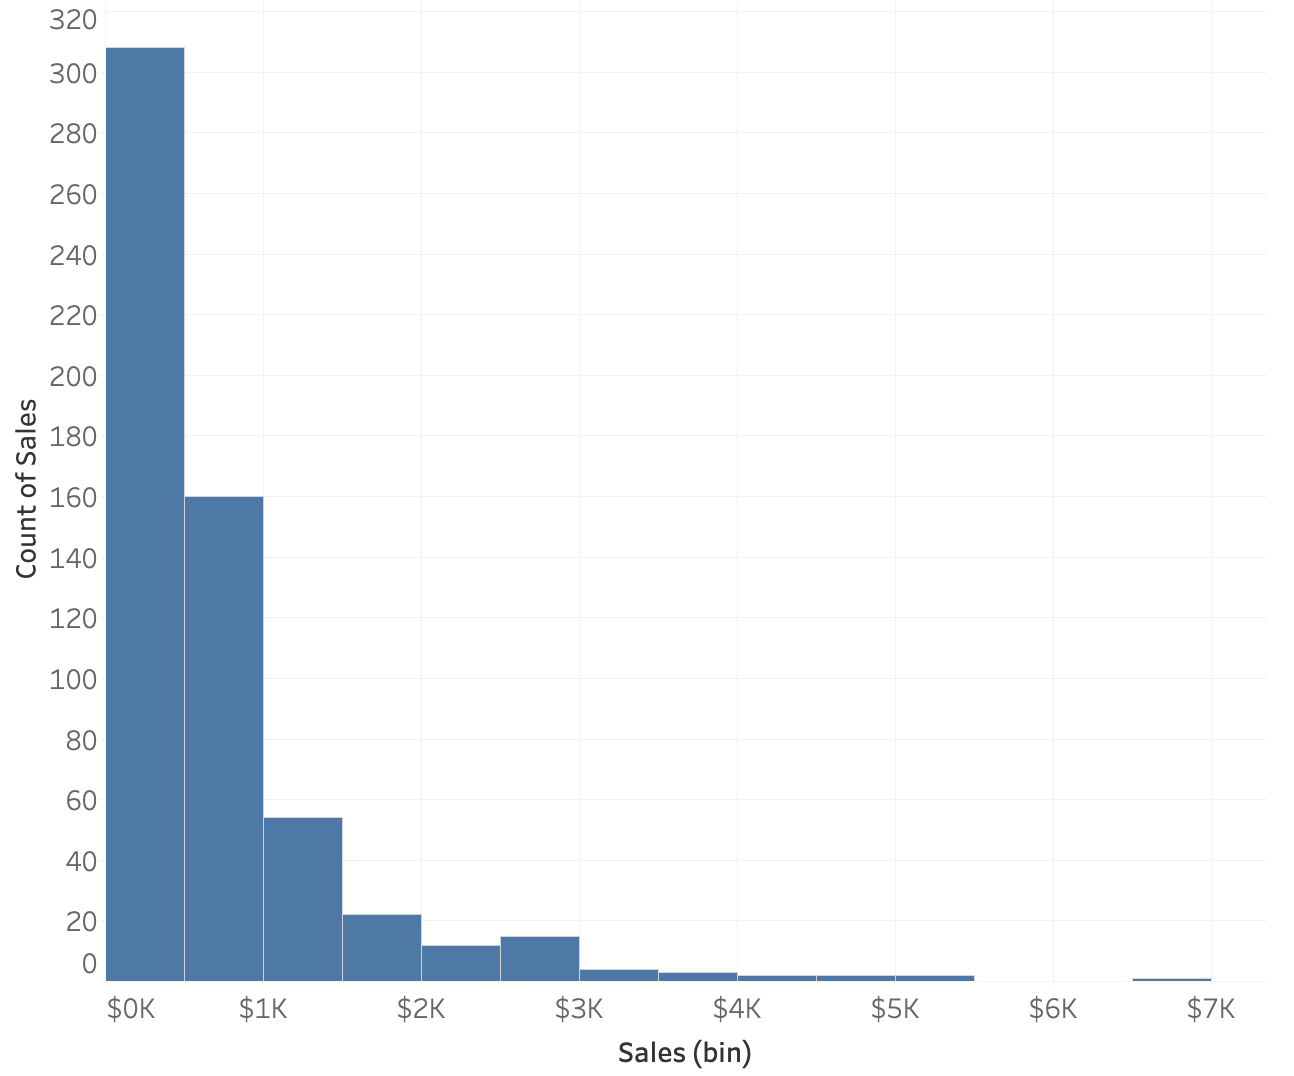
Here is a histogram of sales of office supplies orders. Each row of the dataset represents an order, so each order has one sale value.
Tip: This left-hand pane of the exercise containing text and instructions is resizable. If the plot is too small to see clearly, you can drag to make it bigger.
Cette activité fait partie du cours
Techniques statistiques dans Tableau
Exercice interactif pratique
Passez de la théorie à l’action grâce à l’un de nos exercices interactifs
 Commencer l’exercice