Investigando la variable de edad
Una forma habitual de investigar una variable es contar cuántas veces aparecen determinados valores en los datos.
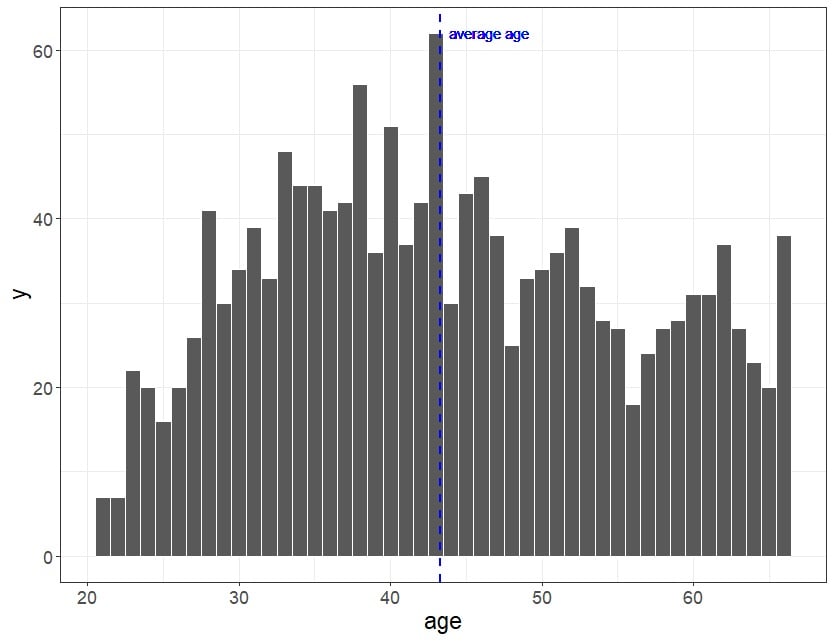
Un histograma, por ejemplo, muestra los recuentos para cada valor de la variable. Es muy útil para comprobar qué valores son los más comunes o cuáles faltan.
La persona de data science de tu equipo ha preparado el histograma que ves aquí para ayudarte a evaluar qué edades están mejor representadas en la encuesta.
 ¿Cuáles de estas afirmaciones sobre la edad son VERDADERAS?
Este ejercicio forma parte del curso
Estudio de caso sobre alfabetización de datos: análisis del trabajo en remoto
ejercicio interactivo práctico
Convierte la teoría en práctica con uno de nuestros ejercicios interactivos
 Empezar ejercicio