Crear una matriz de confusión
En este ejemplo, supón que has ejecutado un modelo y has guardado las predicciones en un vector llamado model_pred. Quieres evaluar cómo ha funcionado el modelo, así que vas a construir una matriz de confusión. Compararás la columna real de estado del préstamo (loan_status) con los valores predichos (model_pred), usando la función table(), donde los argumentos son los valores reales y los valores predichos. Recuerda la estructura de la matriz de confusión:
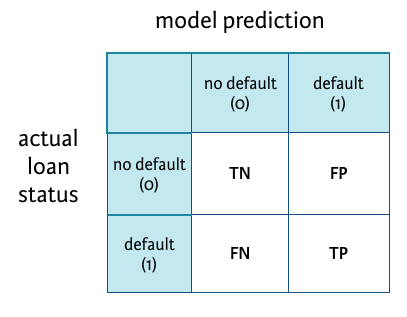
y las fórmulas:
$$\textrm{Classification accuracy} = \frac{(TP + TN)}{(TP + FP + TN + FN)}$$
$$\textrm{Sensitivity} = \frac{TP}{(TP + FN)}$$
$$\textrm{Specificity} = \frac{TN}{(TN + FP)}$$
Este ejercicio forma parte del curso
Modelización del riesgo de crédito en R
Instrucciones del ejercicio
- Crea una matriz de confusión comparando la columna
loan_statusentest_setcon el vectormodel_pred. Puedes usar la función table() con dos argumentos para hacerlo. Guarda la matriz en el objetoconf_matrix. - Calcula la accuracy de clasificación y muestra el resultado. Puedes seleccionar los elementos correctos de la matriz usando
conf_matrix, o copiar y pegar los valores deseados. - Calcula la sensibilidad y muestra el resultado.
ejercicio interactivo práctico
Prueba este ejercicio completando este código de ejemplo.
# Create confusion matrix


# Compute classification accuracy


# Compute sensitivity