Validar los clústeres
En el gráfico de abajo ves los resultados de clustering de la misma alineación con la que trabajaste antes, pero con pequeñas modificaciones en los pasos de agrupamiento.
- El gráfico de la izquierda se generó con
k=2ymethod = 'average' - El gráfico de la derecha se generó con
k=3ymethod = 'complete'
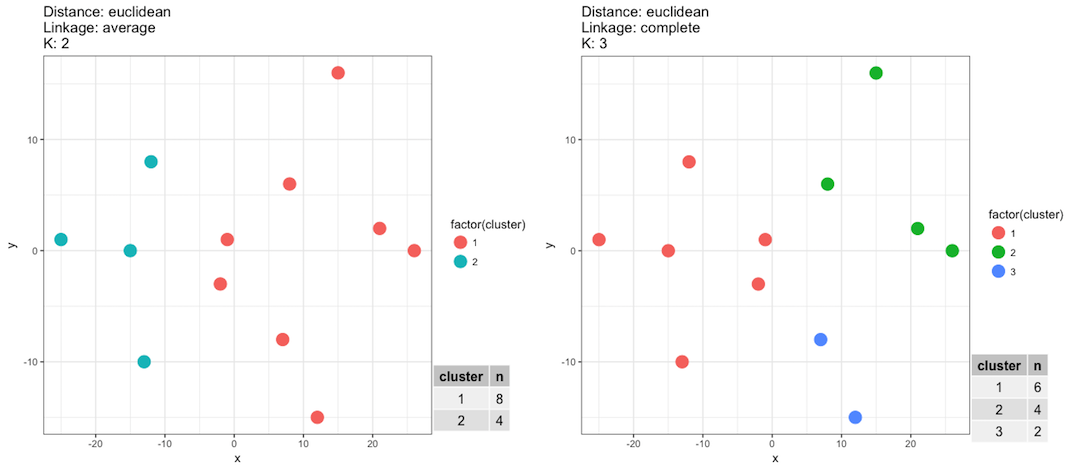
Si nuestro objetivo es asignar correctamente cada jugador a su equipo, entonces, según lo que ves en el gráfico anterior y lo que sabes del conjunto de datos, ¿cuáles de las afirmaciones siguientes son correctas?
Este ejercicio forma parte del curso
Análisis de clústeres en R
ejercicio interactivo práctico
Convierte la teoría en práctica con uno de nuestros ejercicios interactivos
 Empezar ejercicio