Diseños con barra lateral
Las funciones de diseño permiten organizar visualmente entradas y resultados en la interfaz. Un diseño bien elegido hace que una app de Shiny sea más atractiva y también mejora la experiencia de usuario.
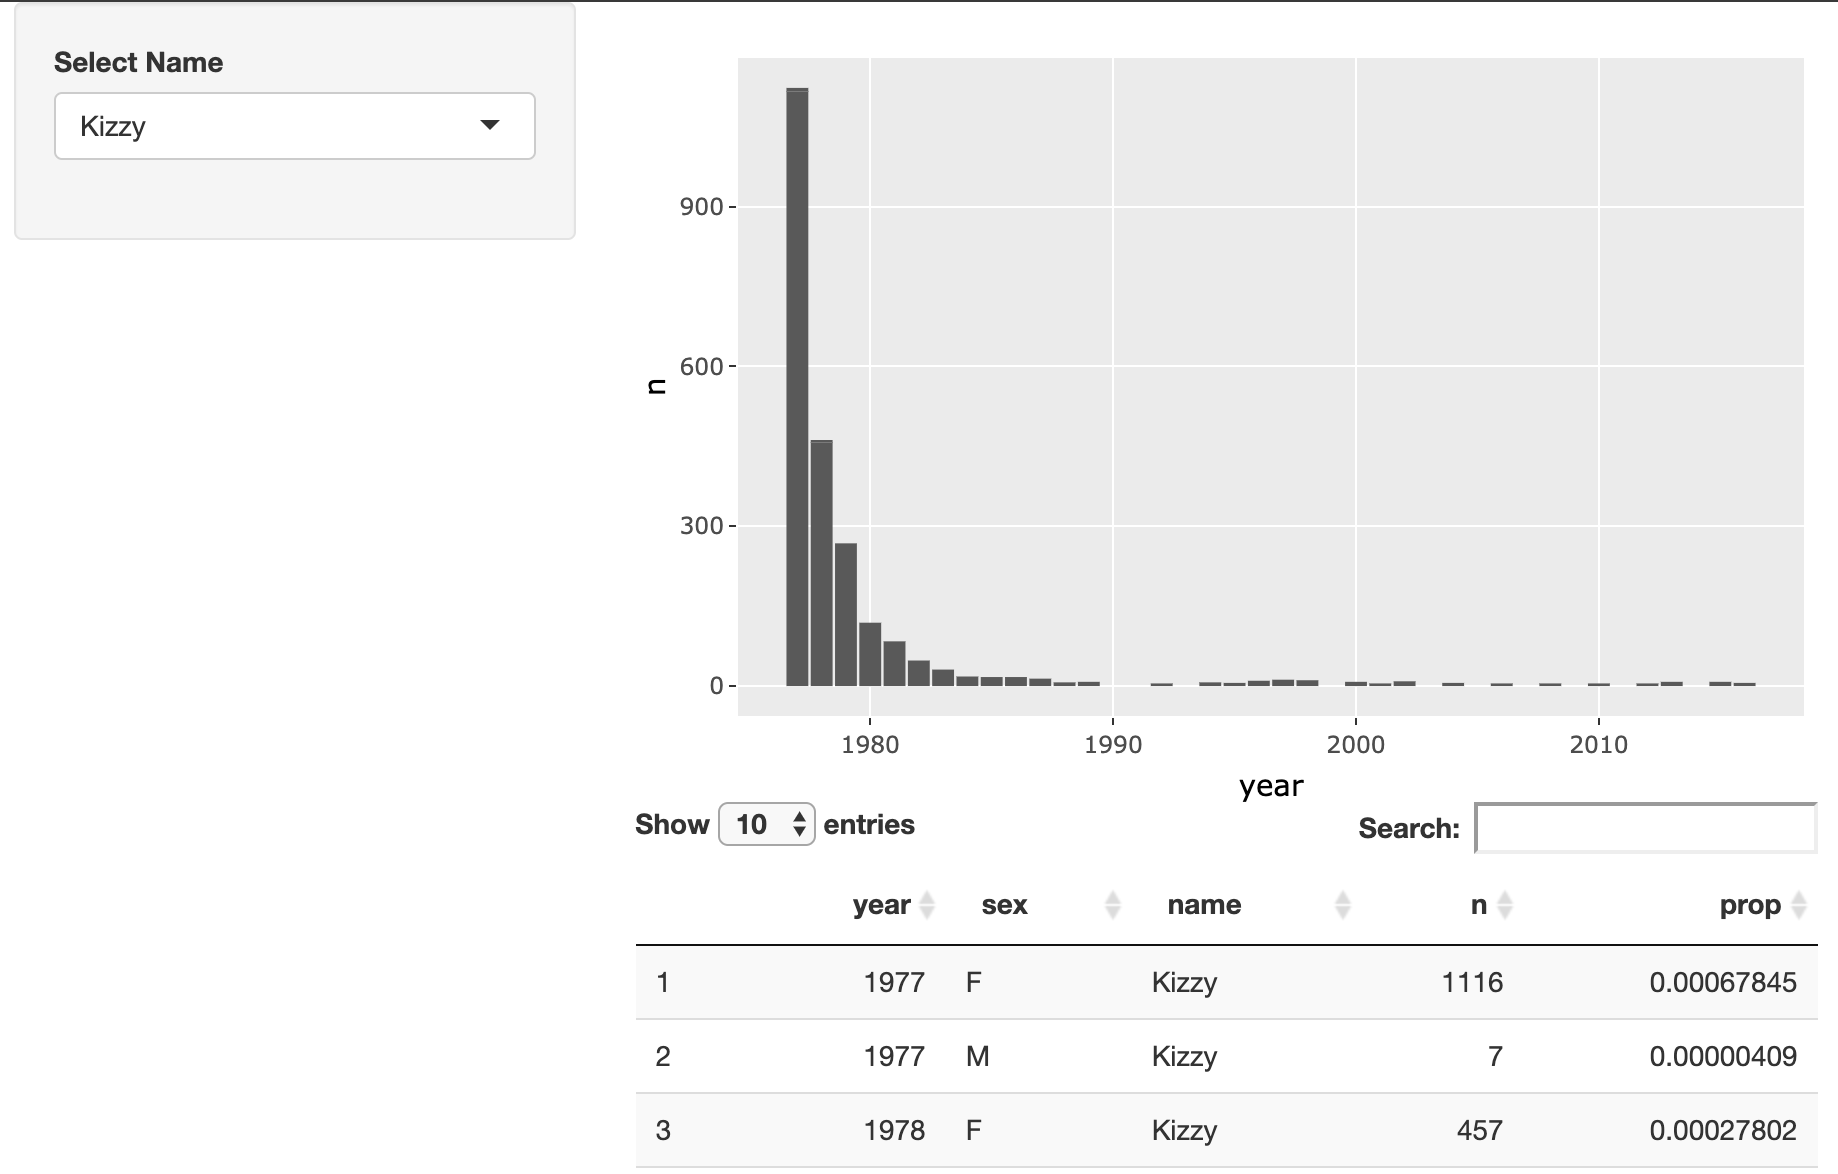
En este ejercicio, vas a modificar el diseño de una app de Shiny que permite explorar la popularidad de nombres de moda. Tu app final debería parecerse visualmente a esto:
Este ejercicio forma parte del curso
Creación de aplicaciones web con Shiny en R
Instrucciones del ejercicio
- Modifica el diseño de esta app para que el selector de nombres aparezca en la barra lateral y el gráfico y la tabla aparezcan a la derecha.
ejercicio interactivo práctico
Prueba este ejercicio completando este código de ejemplo.
ui <- fluidPage(
  # MODIFY CODE BELOW: Wrap in a sidebarLayout
    # MODIFY CODE BELOW: Wrap in a sidebarPanel
    selectInput('name', 'Select Name', top_trendy_names$name),
    # MODIFY CODE BELOW: Wrap in a mainPanel
    plotly::plotlyOutput('plot_trendy_names'),
    DT::DTOutput('table_trendy_names')
)

# DO NOT MODIFY
server <- function(input, output, session){
  # Function to plot trends in a name
  plot_trends <- function(){
     babynames %>%
      filter(name == input$name) %>%
      ggplot(aes(x = year, y = n)) +
      geom_col()
  }
  output$plot_trendy_names <- plotly::renderPlotly({
    plot_trends()
  })

  output$table_trendy_names <- DT::renderDT({
    babynames %>%
      filter(name == input$name)
  })
}

shinyApp(ui = ui, server = server)