Explora cocinas: nubes de palabras
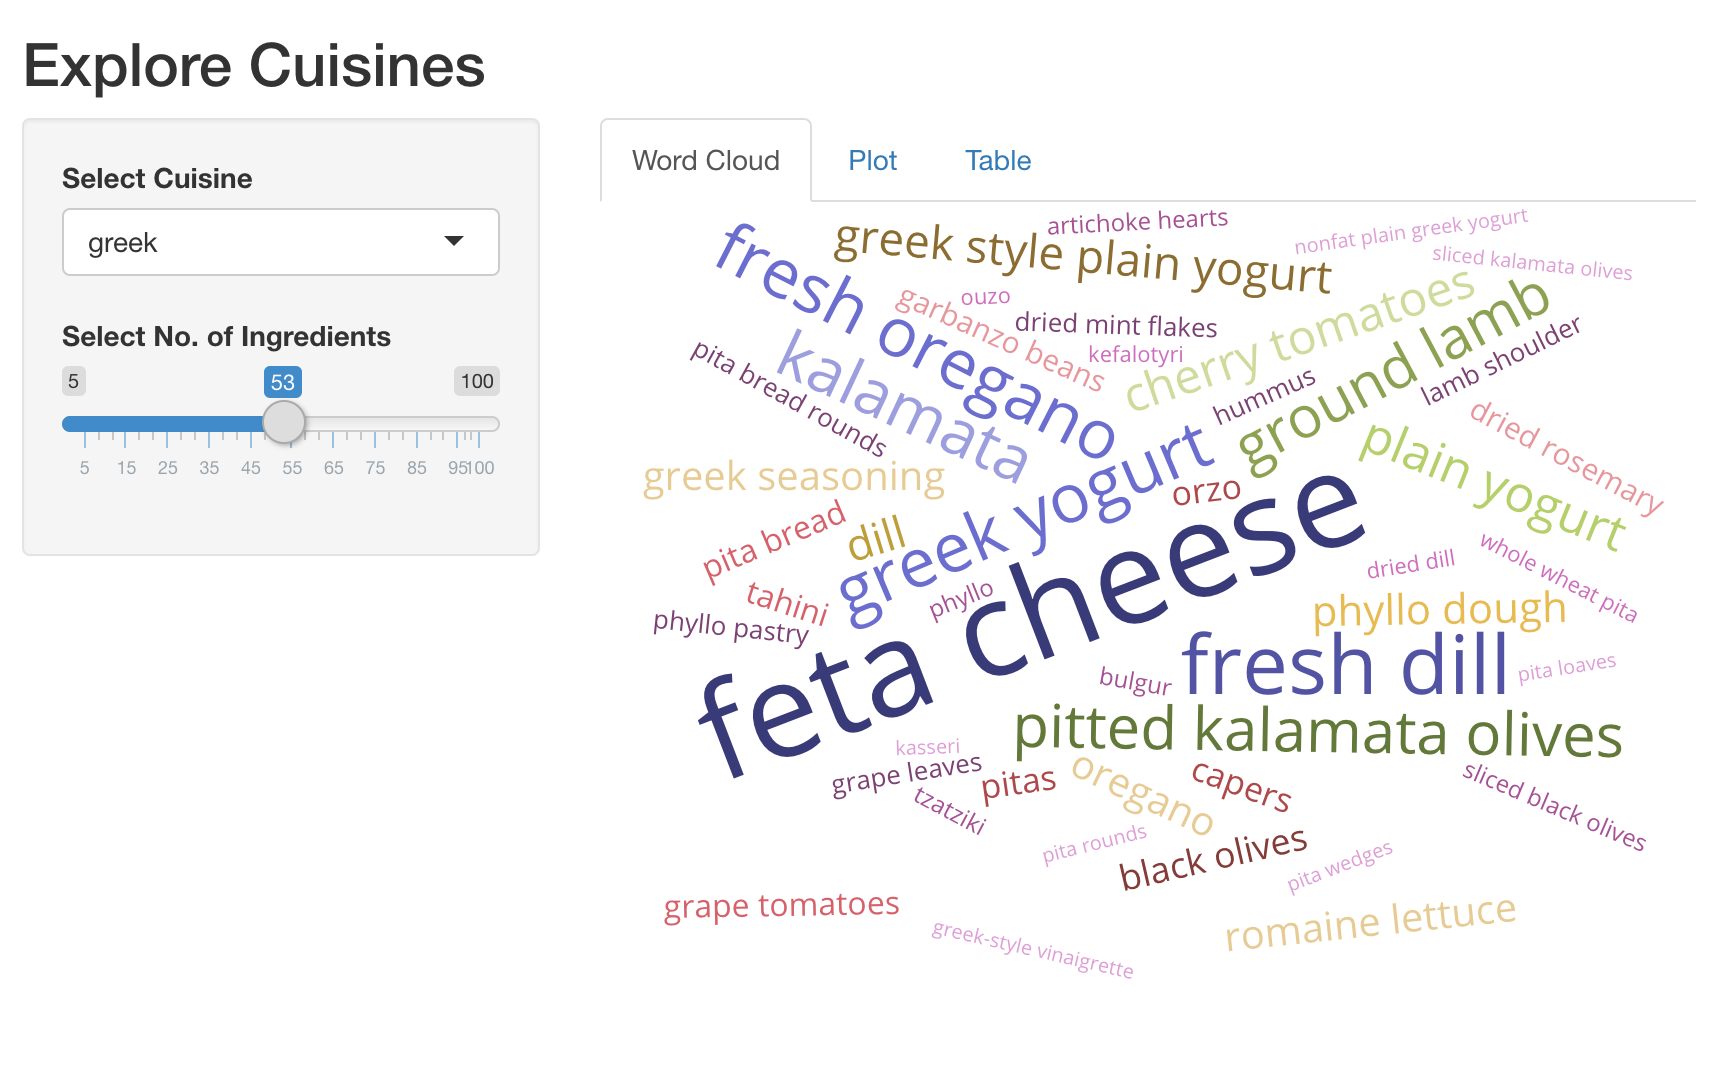
¡Esperamos que te lo estés pasando bien creando estas apps de Shiny sobre comida! Una forma muy útil de visualizar muchos datos son las nubes de palabras. En este ejercicio, ampliarás la app de Shiny que construimos antes y añadirás una nueva pestaña que muestre los ingredientes más distintivos como una nube de palabras interactiva.
Ya hemos cargado los paquetes shiny, dplyr, ggplot2, plotly y
d3wordcloud. Aquí tienes un fragmento útil para crear una nube de palabras.
d3wordcloud(
  words = c('hello', 'world', 'good'),
  freqs = c(20, 40, 30),
  tooltip = TRUE
)
Este ejercicio forma parte del curso
Creación de aplicaciones web con Shiny en R
Instrucciones del ejercicio
- UI: Añade un
d3wordcloudOutput()llamadowc_ingredients, y envuélvelo en untabPanel(). Este debe ser el primertabPanel()de tu app. - Server: Renderiza una nube de palabras interactiva con los ingredientes principales y
el número de recetas en las que se usan, utilizando
d3wordcloud::renderD3wordcloud()y asígnala a una salida llamadawc_ingredients. Necesitarás usar la expresión reactivarval_top_ingredients()para devolver un data frame de los ingredientes principales con sus recuentos de recetas.
ejercicio interactivo práctico
Prueba este ejercicio completando este código de ejemplo.
ui <- fluidPage(
  titlePanel('Explore Cuisines'),
  sidebarLayout(
    sidebarPanel(
      selectInput('cuisine', 'Select Cuisine', unique(recipes$cuisine)),
      sliderInput('nb_ingredients', 'Select No. of Ingredients', 5, 100, 20),
    ),
    mainPanel(
      tabsetPanel(
        # CODE BELOW: Add `d3wordcloudOutput` named `wc_ingredients` in a `tabPanel`

        tabPanel('Plot', plotly::plotlyOutput('plot_top_ingredients')),
        tabPanel('Table', DT::DTOutput('dt_top_ingredients'))
      )
    )
  )
)

server <- function(input, output, session){
  # CODE BELOW: Render an interactive wordcloud of top ingredients and
  # the number of recipes they get used in, using `d3wordcloud::renderD3wordcloud`,
  # and assign it to an output named `wc_ingredients`.


  rval_top_ingredients <- reactive({
    recipes_enriched %>%
      filter(cuisine == input$cuisine) %>%
      arrange(desc(tf_idf)) %>%
      head(input$nb_ingredients) %>%
      mutate(ingredient = forcats::fct_reorder(ingredient, tf_idf))
  })
  output$plot_top_ingredients <- plotly::renderPlotly({
    rval_top_ingredients() %>%
      ggplot(aes(x = ingredient, y = tf_idf)) +
      geom_col() +
      coord_flip()
  })
  output$dt_top_ingredients <- DT::renderDT({
    recipes %>%
      filter(cuisine == input$cuisine) %>%
      count(ingredient, name = 'nb_recipes') %>%
      arrange(desc(nb_recipes)) %>%
      head(input$nb_ingredients)
  })
}

shinyApp(ui = ui, server= server)