Tiroteos masivos: modifica la salida
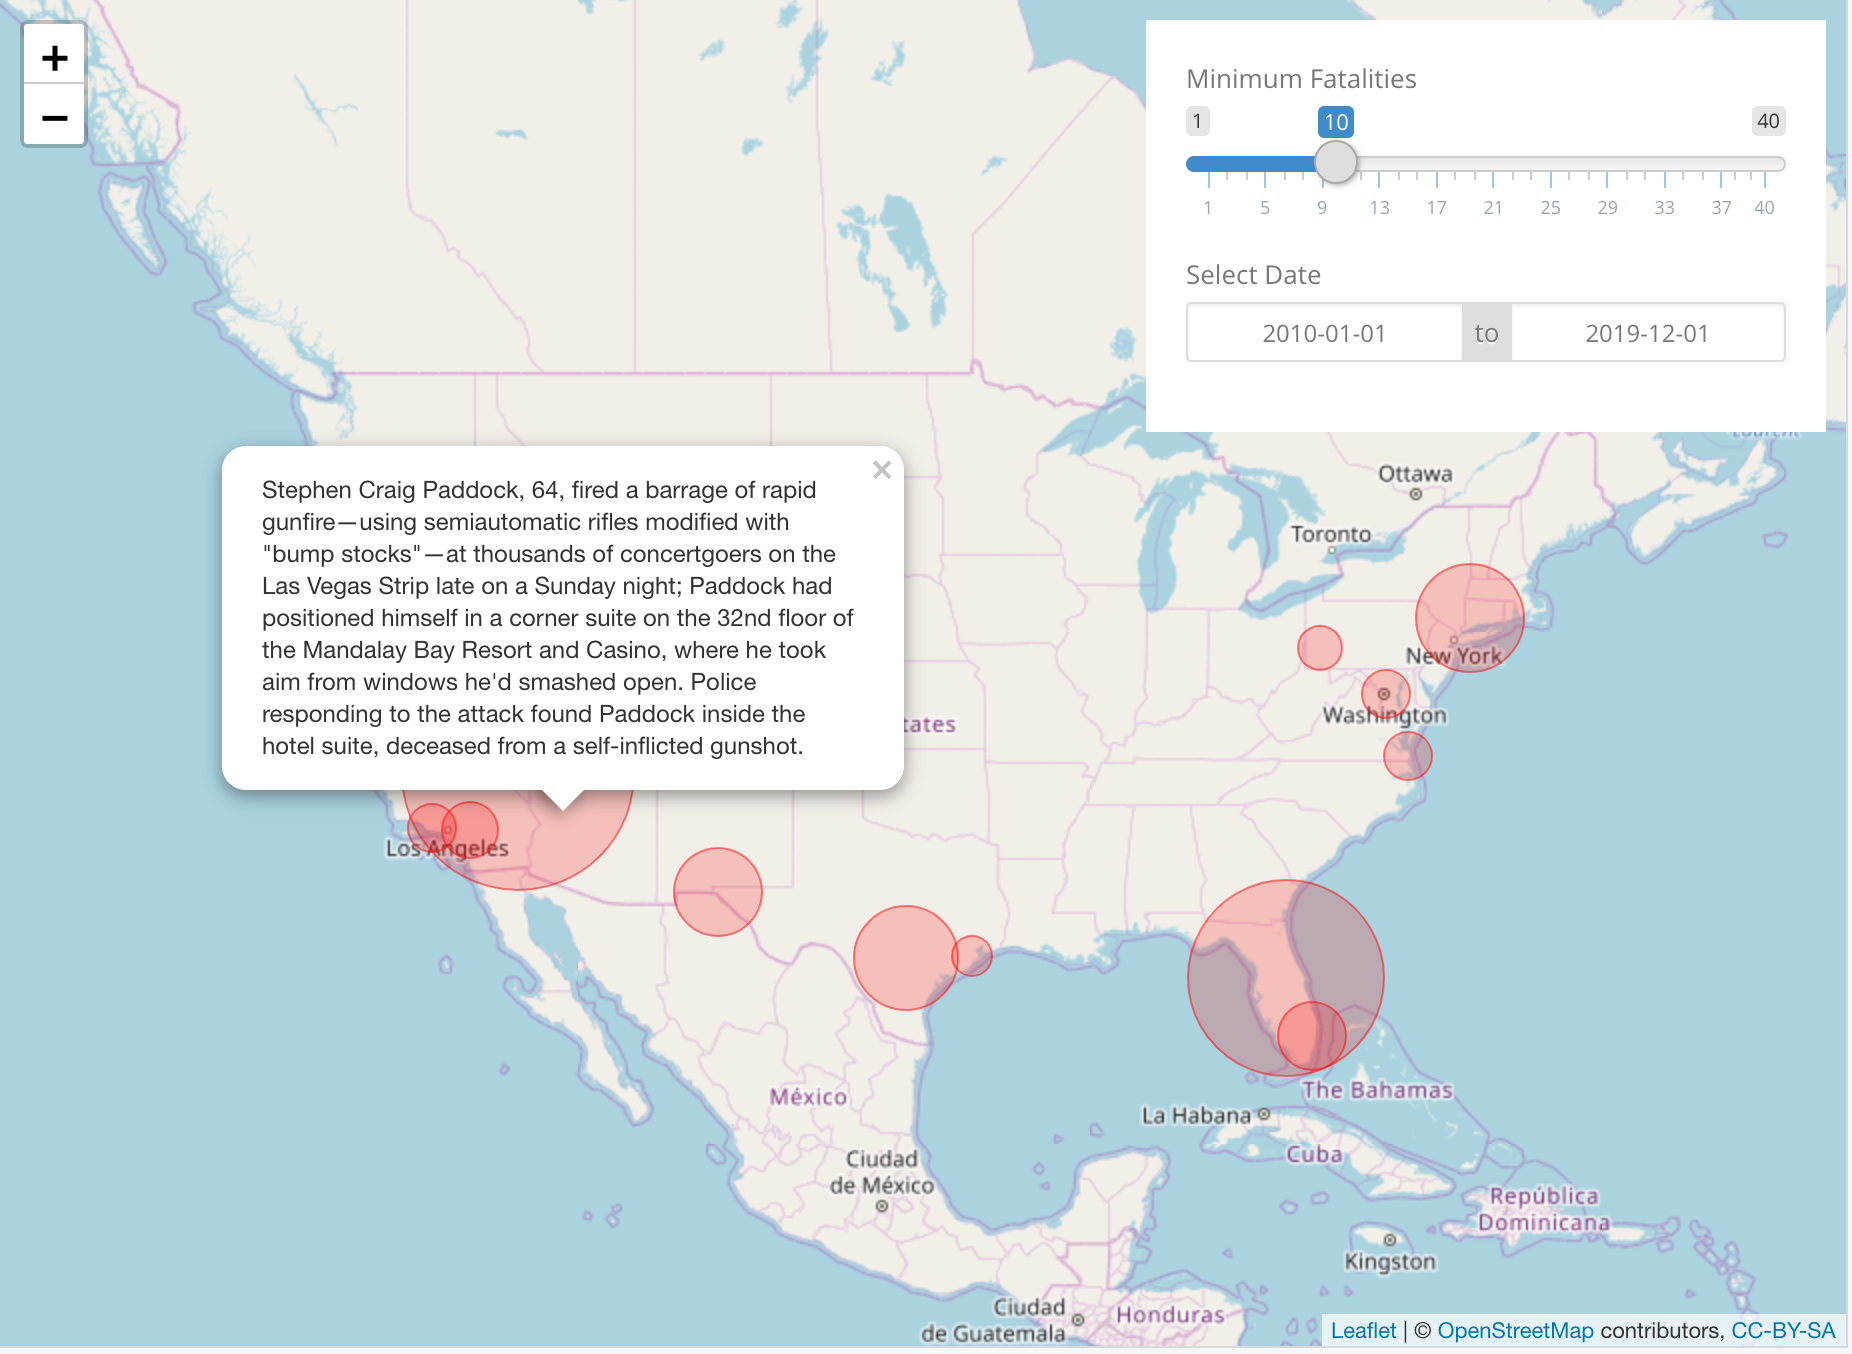
En este ejercicio, vas a ampliar la app de Shiny que creaste antes para que aparezcan círculos rojos cuyo tamaño depende del número de víctimas mortales en el mapa interactivo, y que al hacer clic en un círculo se muestre un resumen del caso. Tu app se parecerá a la imagen de esta captura de pantalla.
Este ejercicio forma parte del curso
Creación de aplicaciones web con Shiny en R
Instrucciones del ejercicio
- Actualiza la expresión reactiva
rval_mass_shootingspara que el conjunto de datos se filtre según el número de víctimas mortales (nb_fatalities) y el rango de fechas (date_range) seleccionados por el usuario. - Actualiza el código dentro de
addCircleMarkers()para que elradiusdel círculo se mapee afatalitiesy el parámetropopupse mapee asummary. Ten en cuenta que puedes mapear un parámetropa un campofusandop = ~ f.
ejercicio interactivo práctico
Prueba este ejercicio completando este código de ejemplo.
ui <- bootstrapPage(
  theme = shinythemes::shinytheme('simplex'),
  leaflet::leafletOutput('map', height = '100%', width = '100%'),
  absolutePanel(top = 10, right = 10, id = 'controls',
    sliderInput('nb_fatalities', 'Minimum Fatalities', 1, 40, 10),
    dateRangeInput('date_range', 'Select Date', "2010-01-01", "2019-12-01")
  ),
  tags$style(type = "text/css", "
    html, body {width:100%;height:100%}
    #controls{background-color:white;padding:20px;}
  ")
)

server <- function(input, output, session) {
  rval_mass_shootings <- reactive({
    # MODIFY CODE BELOW: Filter mass_shootings on nb_fatalities and
    # selected date_range.
    mass_shootings


  })
  output$map <- leaflet::renderLeaflet({
    rval_mass_shootings() %>%
      leaflet() %>%
      addTiles() %>%
      setView( -98.58, 39.82, zoom = 5) %>%
      addTiles() %>%
      addCircleMarkers(
        # CODE BELOW: Add parameters popup and radius and map them
        # to the summary and fatalities columns

        fillColor = 'red', color = 'red', weight = 1
      )
  })
}

shinyApp(ui, server)