Bootstrap-Regressionen
Während du beim Amt für Parks und Erholung von Long Beach die Beziehung zwischen NO2 und SO2 untersuchst, ist dir eine Gruppe potenzieller Ausreißer aufgefallen, von der du vermutest, dass sie die Korrelationen verzerren könnte.
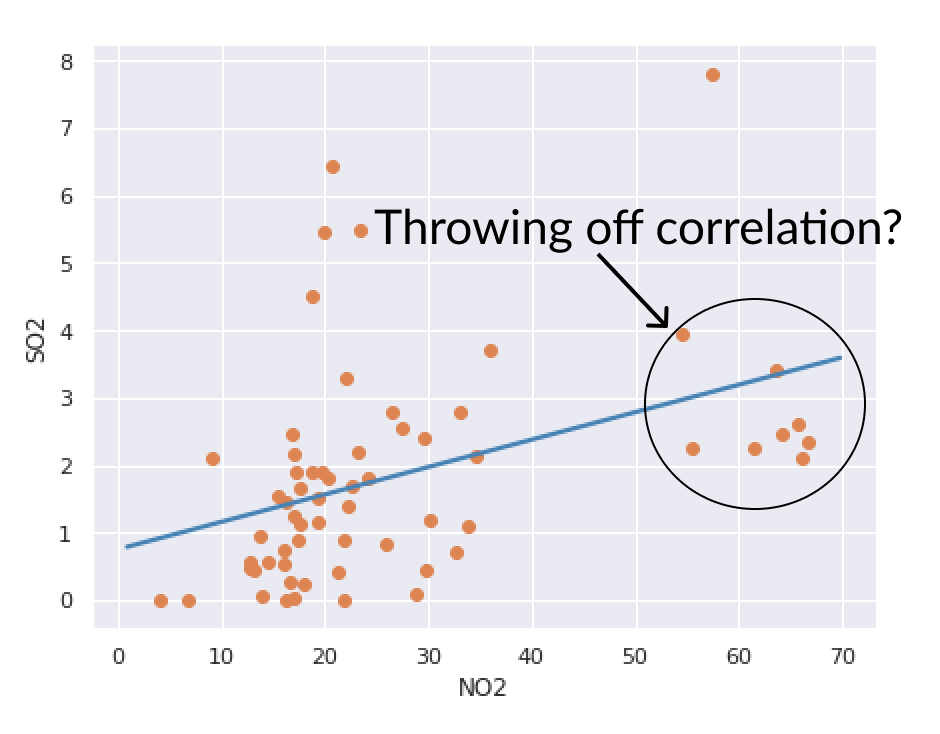
Untersuche die Unsicherheit deiner Korrelationen mittels Bootstrap-Resampling, um zu sehen, wie stabil deine Fits sind. Der Einfachheit halber ist das Bootstrap-Sampling bereits erledigt und wird als no2_so2_boot bereitgestellt, zusammen mit no2_so2 für die nicht neu gesampelten Daten.
Diese Übung ist Teil des Kurses
<Kurs>So verbesserst du deine Datenvisualisierungen in Python</Kurs>Übungsanweisungen
- Teile
sns.lmplot()mit, dass für jedes Bootstrap-sampleeine eigene Regressionslinie gezeichnet werden soll. - Färbe jede Regressionslinie in
'steelblue'und setze die Deckkraft auf 20 %. - Deaktiviere die standardmäßigen Seaborn-Konfidenzbänder um die Regressionslinien.
Interaktive praktische Übung
Versuche dich an dieser Übung, indem du diesen Beispielcode vervollständigst.
sns.lmplot('NO2', 'SO2', data = no2_so2_boot,
           # Tell seaborn to a regression line for each sample
           ____ = 'sample',
           # Make lines blue and transparent
           line_kws = {'____': 'steelblue', '____': 0.2},
           # Disable built-in confidence intervals
           ci = ____, legend = False, scatter = False)

# Draw scatter of all points
plt.scatter('NO2', 'SO2', data = no2_so2)

plt.show()