Data Storytelling in der Praxis
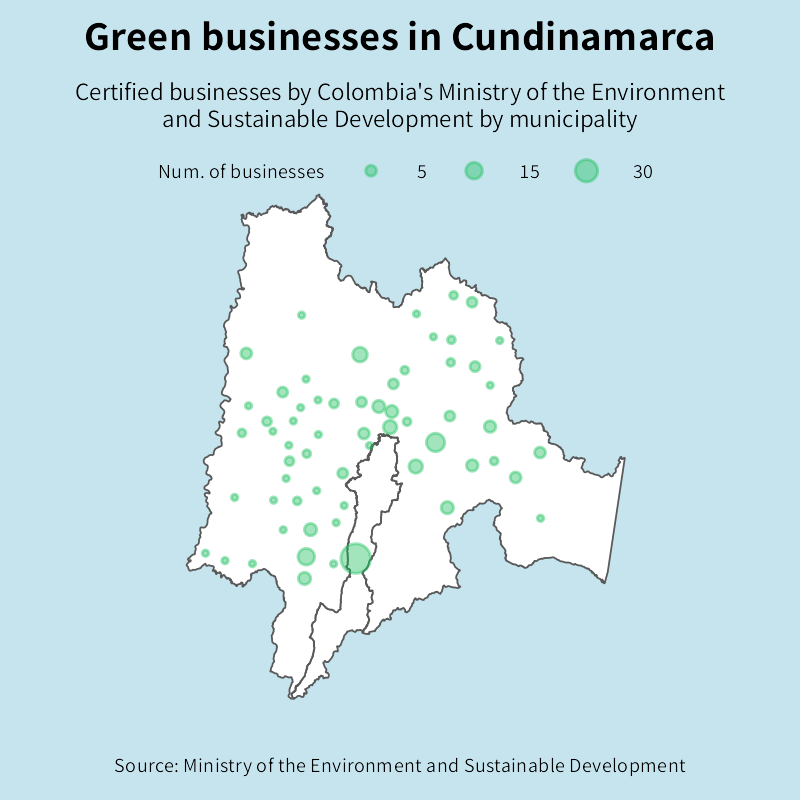
Die folgende Grafik zeigt die Anzahl zertifizierter grüner Unternehmen pro Gemeinde in Cundinamarca, einem der kolumbianischen Departamentos.
Departamentos sind Verwaltungseinheiten in Kolumbien. Für diesen Kurs kannst du sie dir in etwa wie die US-Bundesstaaten vorstellen.
Diese Übung ist Teil des Kurses
<Kurs>Fallstudie Data Storytelling: Grüne Unternehmen</Kurs>Interaktive praktische Übung
Verwandle Theorie mit einer unserer interaktiven Übungen in die Praxis
 Übung starten