Anomalous techniques
As we've seen in the videos, there exist multiple ways to identify anomalous values.
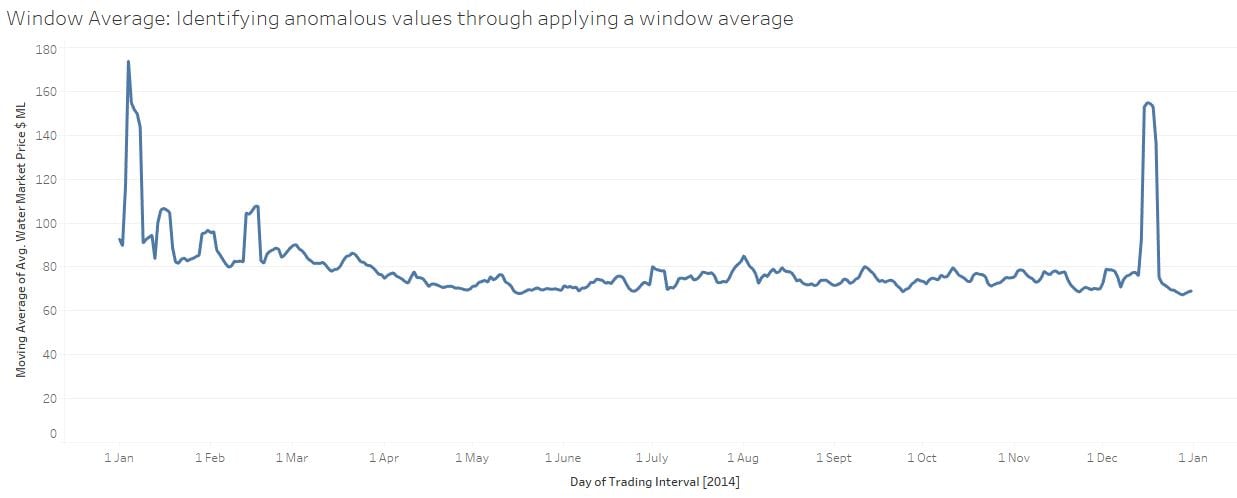
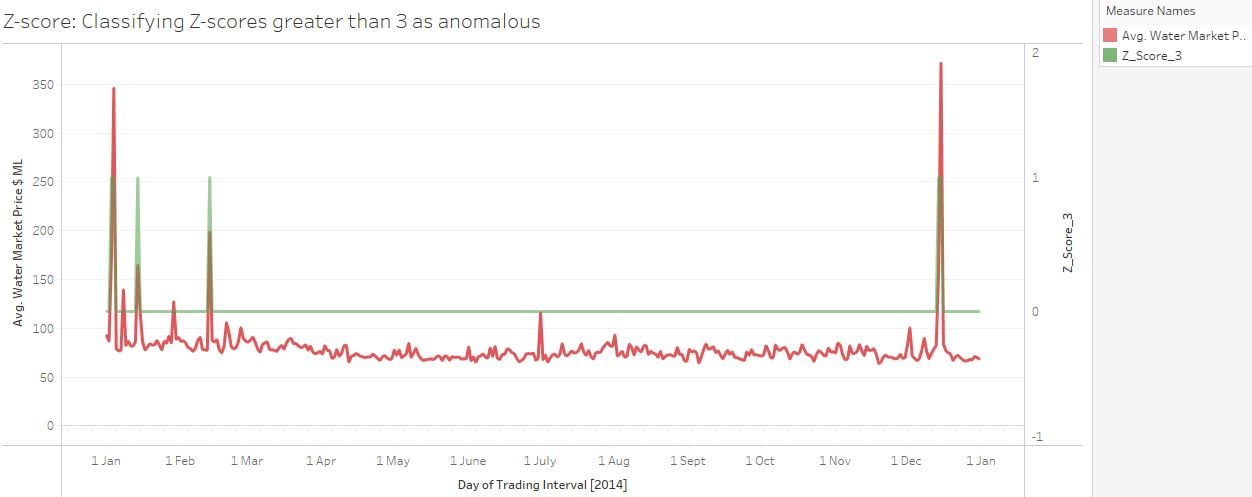
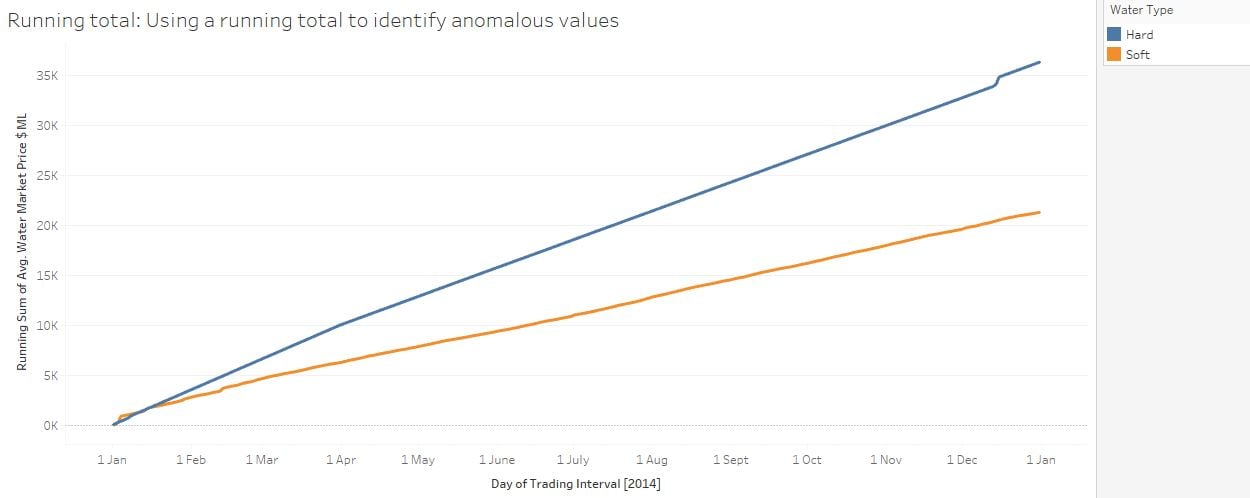
We've created a series of visualizations that may highlight anomaly identification techniques.
Which of the below is not a valid technique to identify anomalous values?
Take a look at the below visuals!
This exercise is part of the course
Time Series Analysis in Tableau
Hands-on interactive exercise
Turn theory into action with one of our interactive exercises
 Start Exercise