Creating a bulleted list
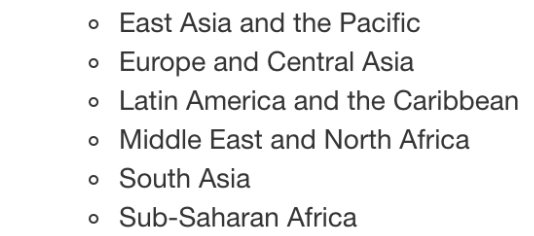
Previously, you learned how to add text to your Markdown file to include additional information for your audience. Now, you'll create a bulleted list to specify which regions are included in the investment_annual_summary data. Refer to the image below from the video to recall the list of regions that should be included in your table.
This exercise is part of the course
Reporting with R Markdown
Exercise instructions
- Add a bulleted list to the report, starting at line
27, of each of the regions included in the data: East Asia and the Pacific, Europe and Central Asia, Latin America and the Caribbean, Middle East and North Africa, South Asia, and Sub-Saharan Africa.
Hands-on interactive exercise
Have a go at this exercise by completing this sample code.
{"investment_report.Rmd":"---\ntitle: \"Investment Report\"\ndate: \"`r format(Sys.time(), '%d %B %Y')`\"\noutput: html_document\n---\n\n```{r setup, include = FALSE}\nknitr::opts_chunk$set(fig.align = 'center', echo = TRUE)\n```\n\n```{r data, include = FALSE}\nlibrary(readr)\nlibrary(dplyr)\nlibrary(ggplot2)\n\ninvestment_annual_summary <- read_csv(\"https://assets.datacamp.com/production/repositories/5756/datasets/d0251f26117bbcf0ea96ac276555b9003f4f7372/investment_annual_summary.csv\")\ninvestment_region_summary <- read_csv(\"https://assets.datacamp.com/production/repositories/5756/datasets/52f5414f6504e0503e86eb1043afa9b3d157fab2/investment_region_summary.csv\")\ninvestment_services_projects <- read_csv(\"https://assets.datacamp.com/production/repositories/5756/datasets/bcb2e39ecbe521f4b414a21e35f7b8b5c50aec64/investment_services_projects.csv\")\n```\n\n\n## Datasets \n### Investment Annual Summary\nThe `investment_annual_summary` dataset provides a summary of the dollars in millions provided to each of the following regions for each fiscal year, from 2012 to 2018:\n\n\n\n\n\n\n\n\n```{r investment-annual-summary, out.width = '85%', fig.cap = 'Figure 1.1 The Investment Annual Summary for each region for 2012 to 2018.'}\nggplot(investment_annual_summary, aes(x = fiscal_year, y = dollars_in_millions, color = region)) +\n geom_line() +\n labs(\n title = \"Investment Annual Summary\",\n x = \"Fiscal Year\",\n y = \"Dollars in Millions\"\n )\n```\n\n### Investment Projects in Brazil\nThe `investment_services_projects` dataset provides information about each investment project from 2012 to 2018. Information listed includes the project name, company name, sector, project status, and investment amounts.\n\n```{r brazil-investment-projects, out.width = '95%', fig.cap = 'Figure 1.2 The Investment Services Projects in Brazil from 2012 to 2018.'}\nbrazil_investment_projects <- investment_services_projects %>%\n filter(country == \"Brazil\") \n\nggplot(brazil_investment_projects, aes(x = date_disclosed, y = total_investment, color = status)) +\n geom_point() +\n labs(\n title = \"Investment Services Projects in Brazil\",\n x = \"Date Disclosed\",\n y = \"Total IFC Investment in Dollars in Millions\"\n )\n```\n\n### Investment Projects in Brazil in 2018\nThe `investment_services_projects` dataset was filtered below to focus on information about each investment project from the 2018 fiscal year, and is referred to as `brazil_investment_projects_2018`. \n\n```{r brazil-investment-projects-2018, out.width = '95%', fig.cap = 'Figure 1.3 The Investment Services Projects in Brazil in 2018.'}\nbrazil_investment_projects_2018 <- investment_services_projects %>%\n filter(country == \"Brazil\",\n date_disclosed >= \"2017-07-01\",\n date_disclosed <= \"2018-06-30\") \n\nggplot(brazil_investment_projects_2018, aes(x = date_disclosed, y = total_investment, color = status)) +\n geom_point() +\n labs(\n title = \"Investment Services Projects in Brazil in 2018\",\n x = \"Date Disclosed\",\n y = \"Total IFC Investment in Dollars in Millions\"\n ) \n```\n\n\n"}