Recognizing the normal distribution
The normal distribution is commonly observed in the real-world, such as shoe size, adult height, birth weight of babies, and IQ scores; therefore, it is important to be able to recognize this distribution when visualizing data.
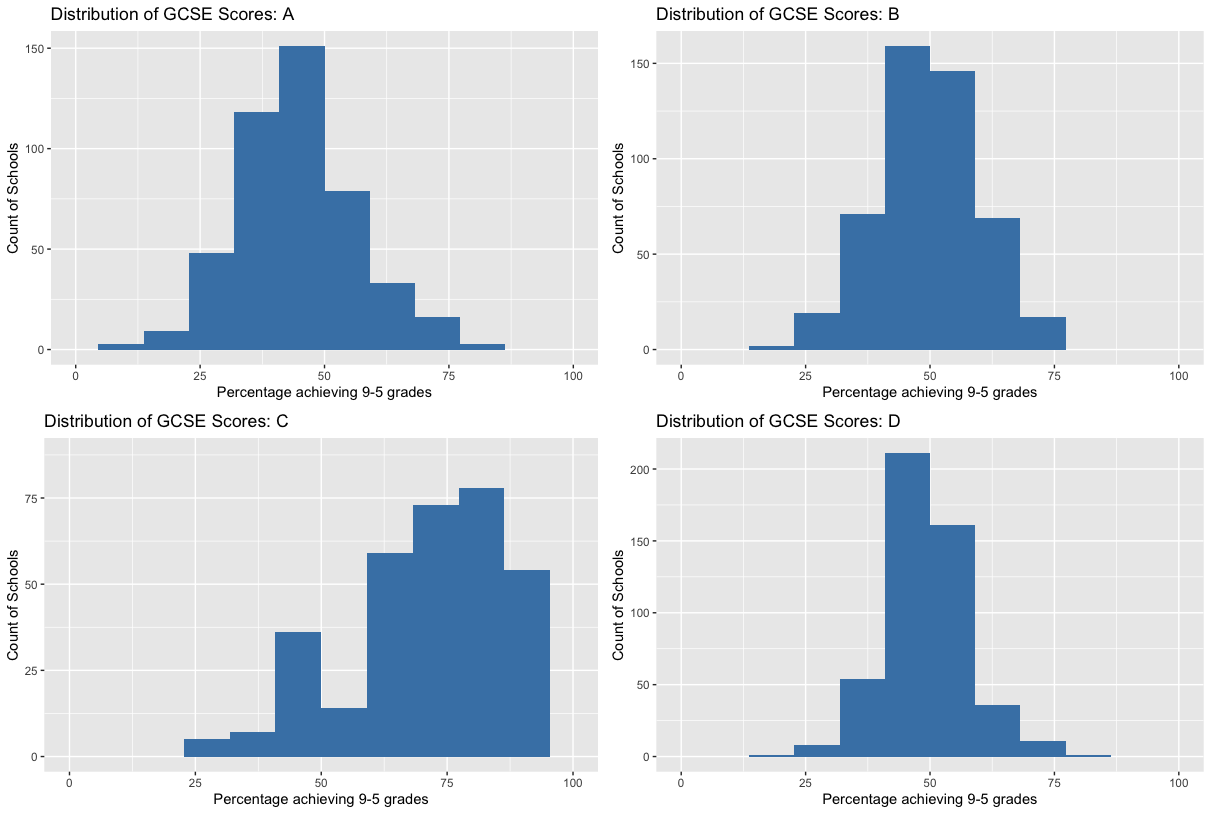
Here is a grid of four plots displaying the distribution of schools achieving various percentages of pass grades for secondary school exams in the United Kingdom, where each visualization represents students from a different ethnicity.
Your task is to identify which of these plots does not represent a normal distribution.
This exercise is part of the course
Introduction to Statistics
Hands-on interactive exercise
Turn theory into action with one of our interactive exercises
 Start Exercise