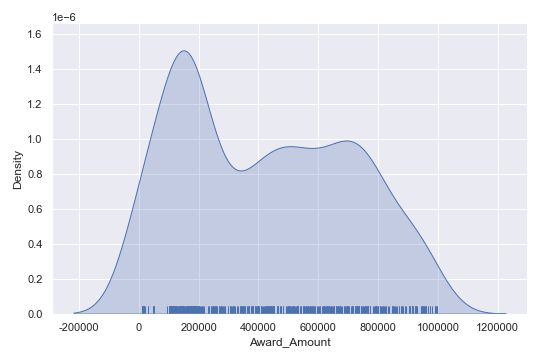
Interpreting the results
Looking at this displot, which of these choices can you infer based on the visualization?
This exercise is part of the course
Intermediate Data Visualization with Seaborn
Hands-on interactive exercise
Turn theory into action with one of our interactive exercises
 Start Exercise