Investigating the age variable
A common way to investigate a variable is to count how many times specific values are present in the data.
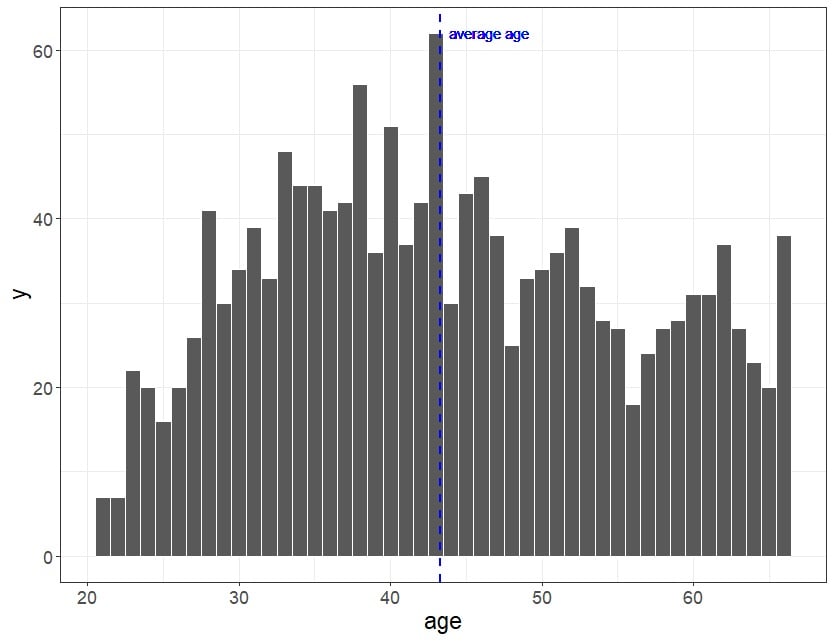
A histogram, for example, shows the counts for each variable value. It is very helpful for checking which values are the most common or which values are missing.
The data scientist in your team has prepared the histogram you can see here to help you evaluate how well different ages are represented in the survey.
 Which statements about age are TRUE?
This exercise is part of the course
Data Literacy Case Study: Remote Working Analysis
Hands-on interactive exercise
Turn theory into action with one of our interactive exercises
 Start Exercise