Histogramları yorumlama
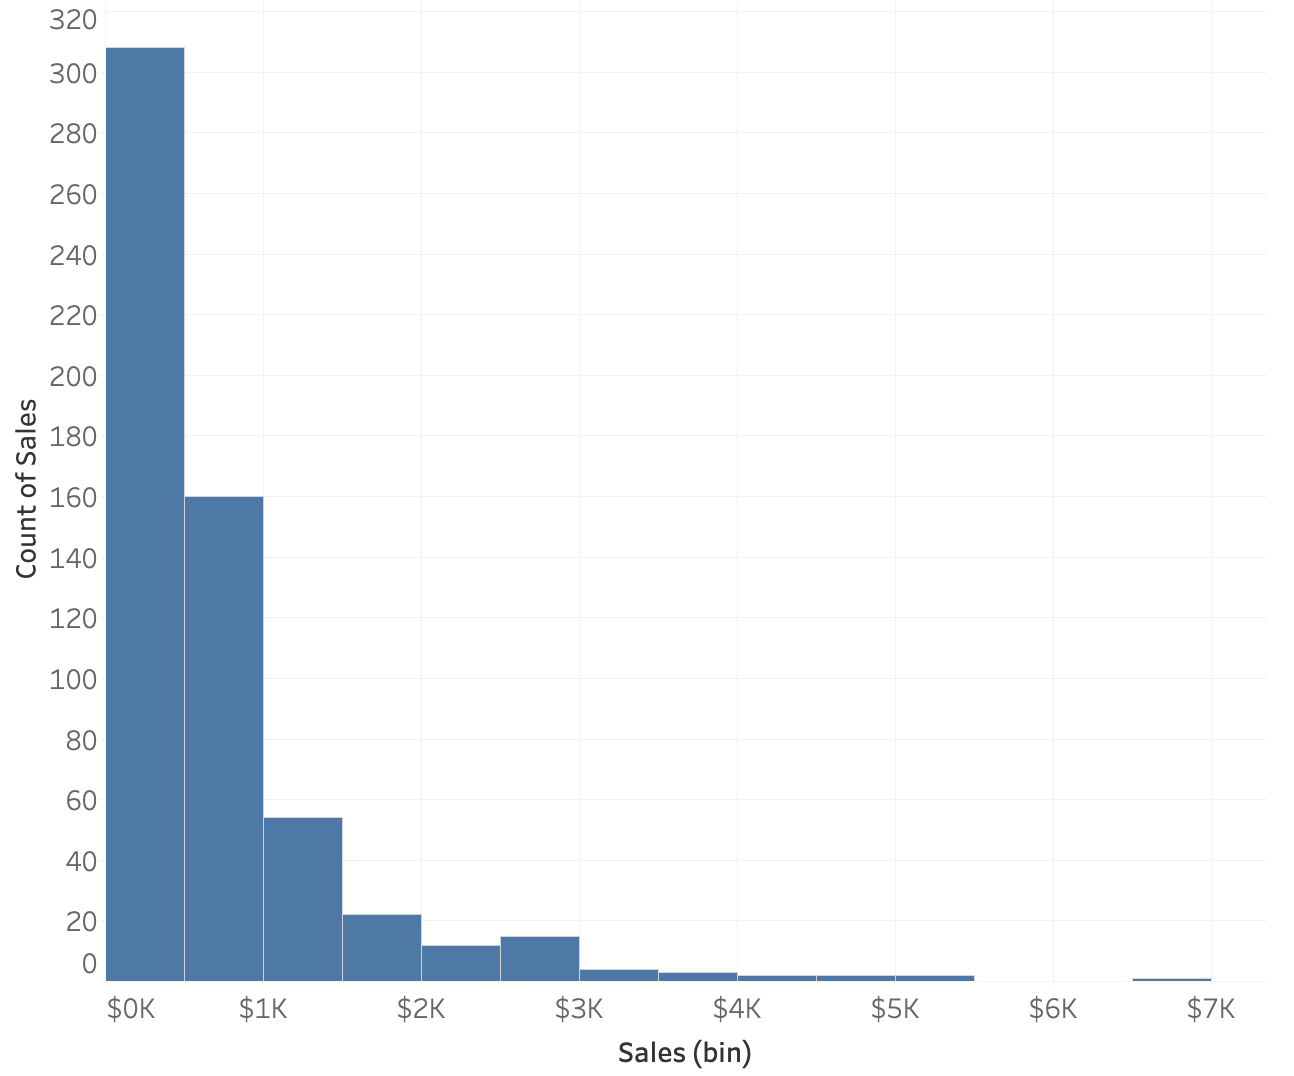
Burada ofis malzemeleri siparişlerinin satışlarına ait bir histogram var. Veri kümesindeki her satır bir siparişi temsil eder, yani her siparişin tek bir satış değeri vardır.
İpucu: Metin ve talimatların bulunduğu bu egzersizin sol bölmesi yeniden boyutlandırılabilir. Grafiği net göremiyorsan, sürükleyerek daha büyük yapabilirsin.
Bu egzersiz, kursun bir parçasıdır
Tableau'da İstatistiksel Teknikler
Uygulamalı etkileşimli egzersiz
Teoriyi etkileşime dönüştürün, interaktif egzersizlerimizden biriyle
 Egzersize başla