Base quality plot
This figure has been created for you from the base quality encodings of a complete fastq file. This file uses Illumina encoding. The
maximum encoding is I, or a score of 40. Good quality encodings have scores of 33 or above, or in other words, are B or above.
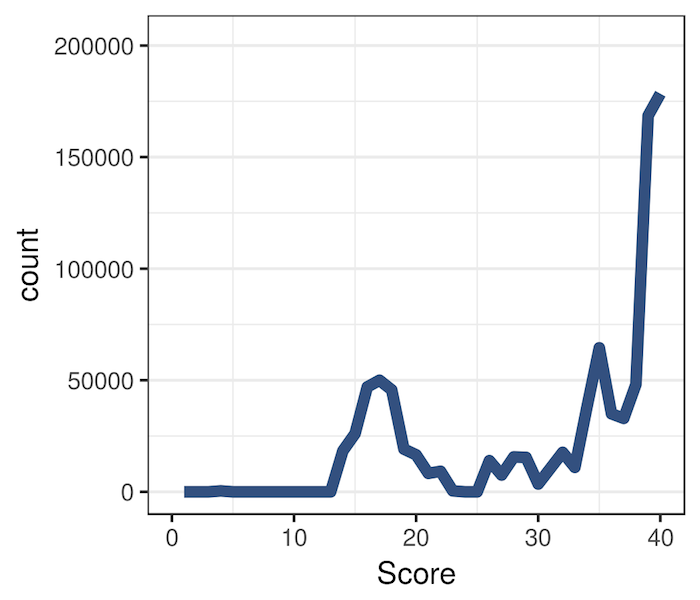
You can see encoding details for Illumina here.
- Which scores are represented most in the figure?
Bu egzersiz, kursun bir parçasıdır
Introduction to Bioconductor in R
Uygulamalı etkileşimli egzersiz
Teoriyi etkileşime dönüştürün, interaktif egzersizlerimizden biriyle
 Egzersize başla