Yaş değişkenini incelemek
Bir değişkeni incelemenin yaygın bir yolu, belirli değerlerin veride kaç kez geçtiğini saymaktır.
Örneğin bir histogram, her değişken değeri için sayımları gösterir. Hangi değerlerin daha yaygın olduğunu ya da hangi değerlerin eksik olduğunu kontrol etmek için çok faydalıdır.
Ekibindeki veri bilimci, ankette farklı yaşların ne kadar iyi temsil edildiğini değerlendirmeni kolaylaştırmak için burada gördüğün histogramı hazırladı.
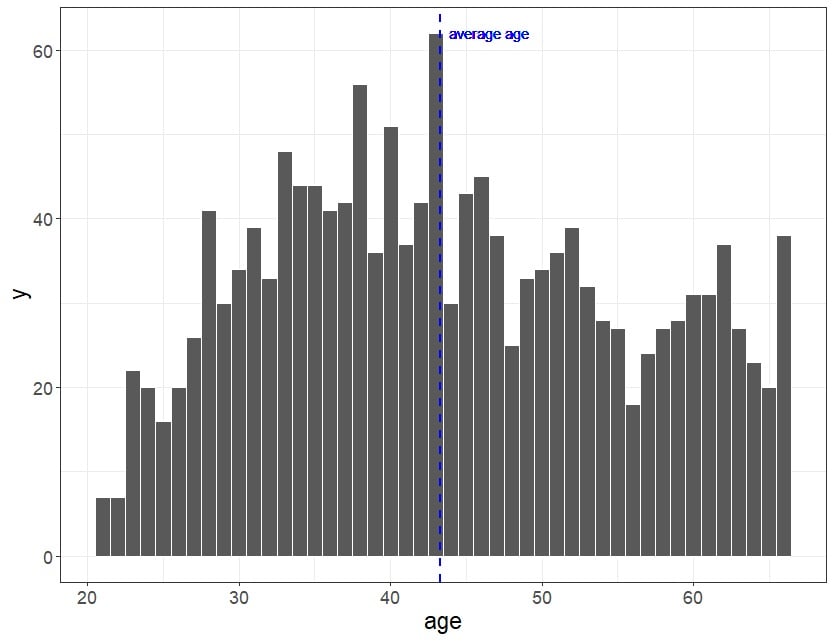 Yaşla ilgili aşağıdaki ifadelerden hangileri DOĞRU?
Bu egzersiz, kursun bir parçasıdır
Veri Okuryazarlığı Vaka Çalışması: Uzaktan Çalışma Analizi
Uygulamalı etkileşimli egzersiz
Teoriyi etkileşime dönüştürün, interaktif egzersizlerimizden biriyle
 Egzersize başla