Kenar çubuğu yerleşimleri
Yerleşim (layout) işlevleri, giriş ve çıktıları UI içinde görsel olarak düzenlemene olanak tanır. İyi seçilmiş bir yerleşim, bir Shiny uygulamasını görsel olarak daha çekici kılar ve aynı zamanda kullanıcı deneyimini iyileştirir.
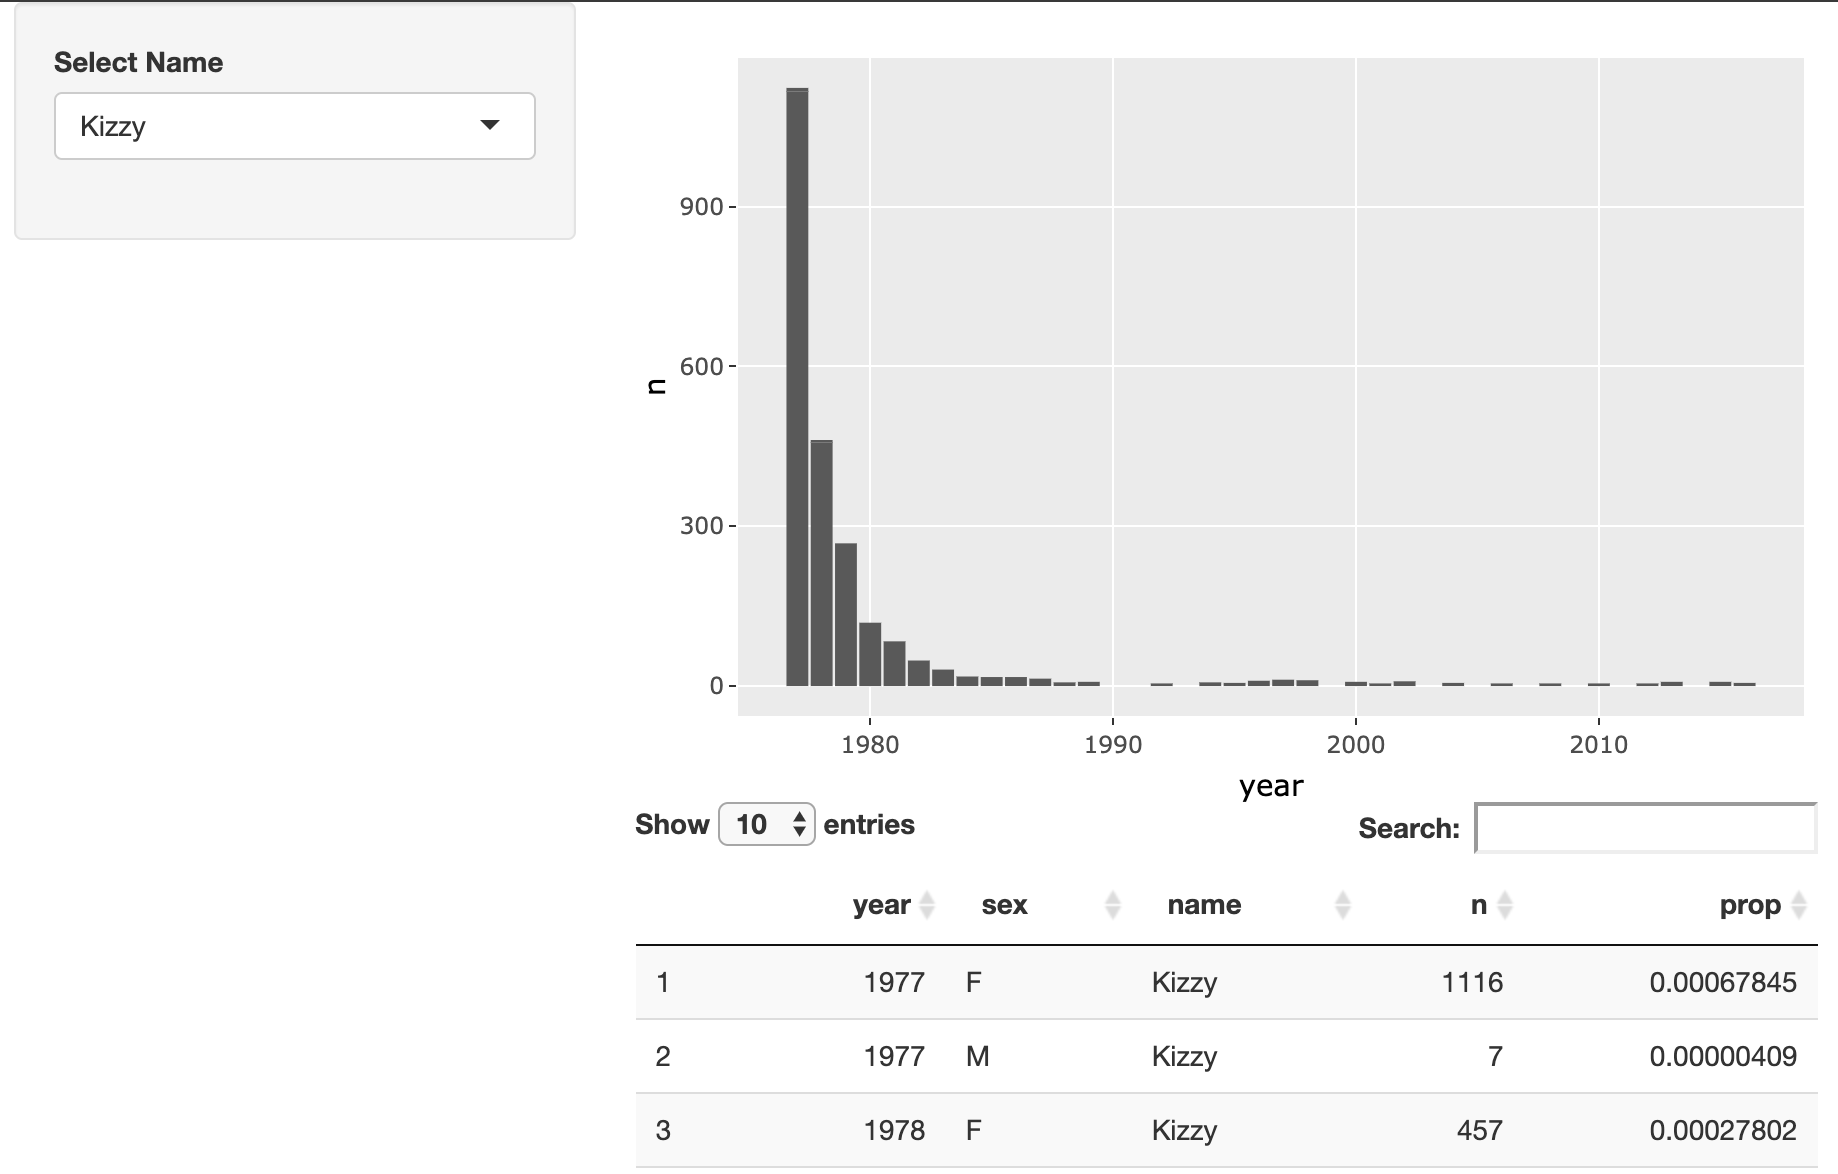
Bu egzersizde, kullanıcıların popülerleşen isimlerin yaygınlığını keşfetmesini sağlayan bir Shiny uygulamasının yerleşimini değiştireceksin. Son uygulaman görsel olarak buna benzeyecek:
Bu egzersiz, kursun bir parçasıdır
R ile Shiny Kullanarak Web Uygulamaları Geliştirme
Egzersiz talimatları
- Bu uygulamanın yerleşimini, isim seçicinin kenar çubuğunda; grafiğin ve tablonun ise sağda görünmesi için değiştir.
Uygulamalı etkileşimli egzersiz
Bu egzersizi bu örnek kodu tamamlayarak deneyin.
ui <- fluidPage(
  # MODIFY CODE BELOW: Wrap in a sidebarLayout
    # MODIFY CODE BELOW: Wrap in a sidebarPanel
    selectInput('name', 'Select Name', top_trendy_names$name),
    # MODIFY CODE BELOW: Wrap in a mainPanel
    plotly::plotlyOutput('plot_trendy_names'),
    DT::DTOutput('table_trendy_names')
)

# DO NOT MODIFY
server <- function(input, output, session){
  # Function to plot trends in a name
  plot_trends <- function(){
     babynames %>%
      filter(name == input$name) %>%
      ggplot(aes(x = year, y = n)) +
      geom_col()
  }
  output$plot_trendy_names <- plotly::renderPlotly({
    plot_trends()
  })

  output$table_trendy_names <- DT::renderDT({
    babynames %>%
      filter(name == input$name)
  })
}

shinyApp(ui = ui, server = server)