Interpreting dendrogram
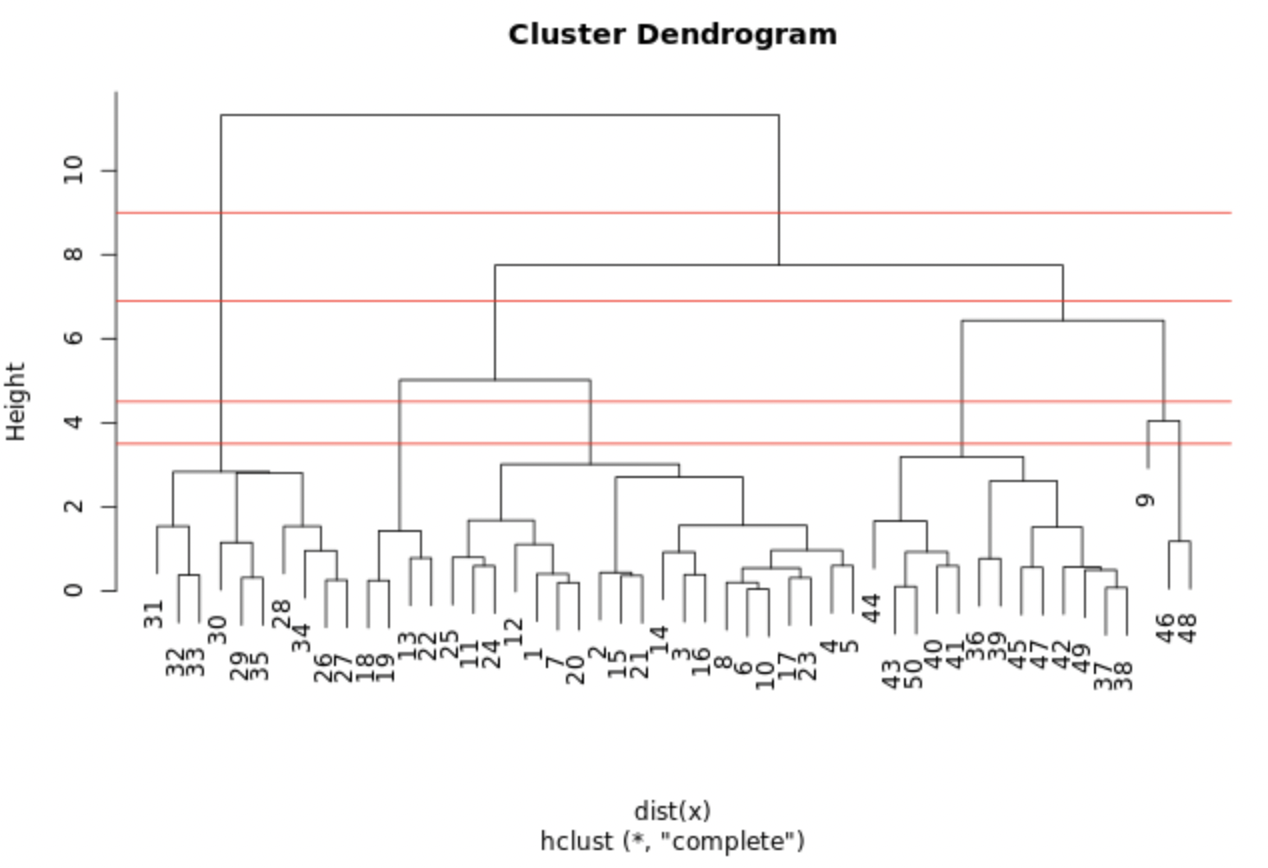
The plot displayed shows the hclust.out model you constructed in the previous exercise. We've drawn horizontal lines at heights of 3.5, 4.5, 6.9, and 9.0, respectively.
Which cut point yields 3 clusters?
แบบฝึกหัดนี้เป็นส่วนหนึ่งของหลักสูตร
Unsupervised Learning in R
แบบฝึกหัดเชิงโต้ตอบแบบลงมือทำจริง
เปลี่ยนทฤษฎีให้เป็นการลงมือทำด้วยแบบฝึกหัดเชิงโต้ตอบหนึ่งในของเรา
 เริ่มแบบฝึกหัด