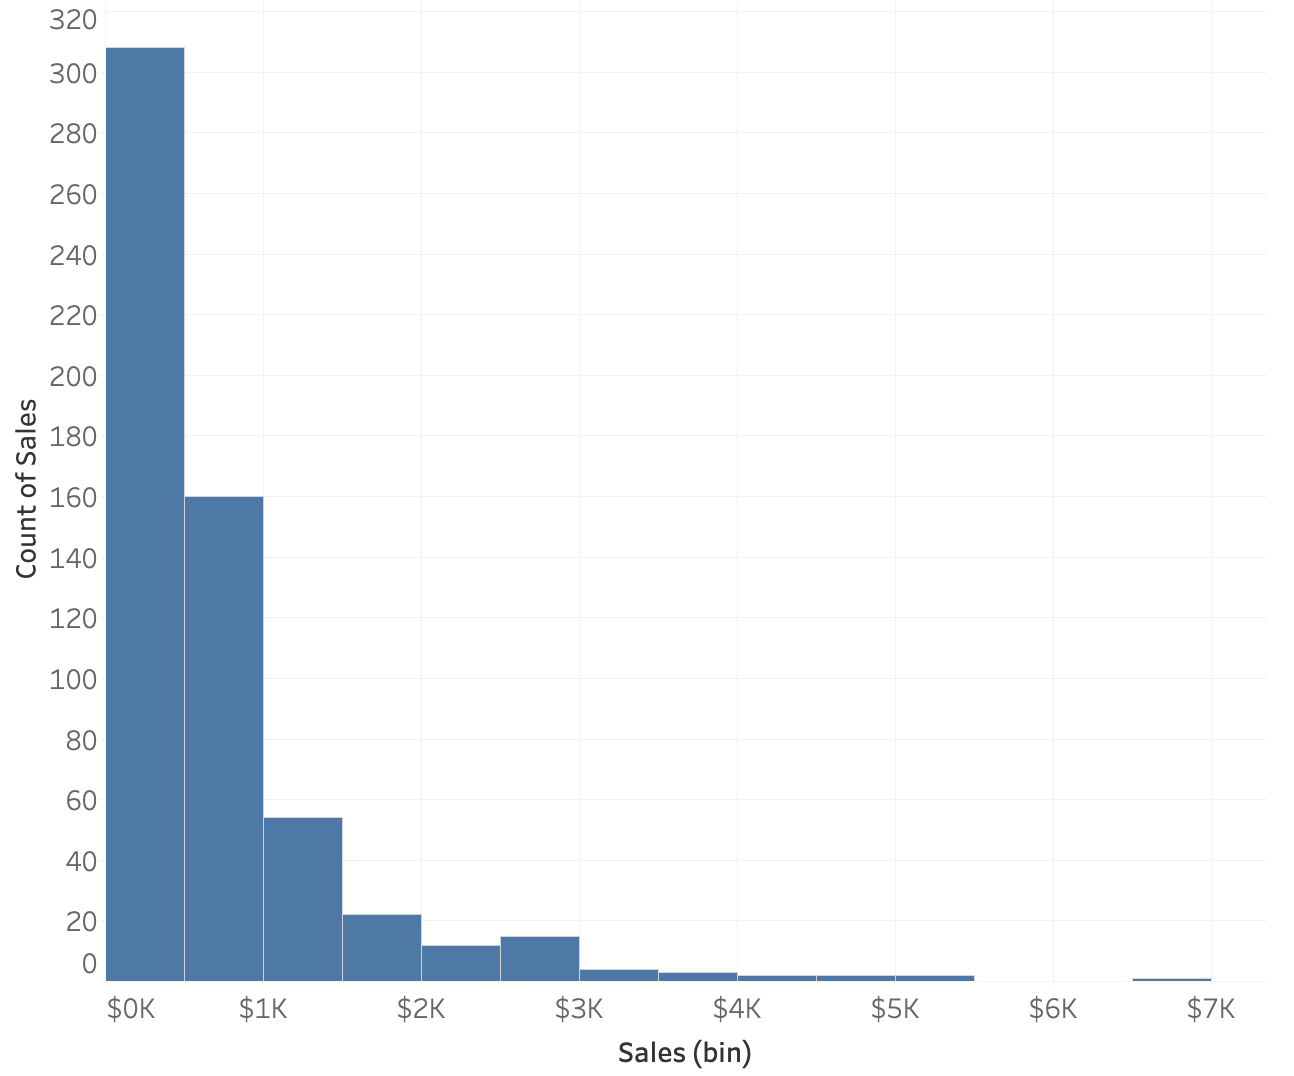
การอ่านและตีความฮิสโตแกรม
นี่คือฮิสโตแกรมแสดงยอดขายของคำสั่งซื้อในหมวดอุปกรณ์สำนักงาน แต่ละแถวของชุดข้อมูลแทนคำสั่งซื้อหนึ่งรายการ ดังนั้นแต่ละคำสั่งซื้อจึงมีค่ายอดขายหนึ่งค่า
เคล็ดลับ: พื้นที่ด้านซ้ายของแบบฝึกหัดที่แสดงข้อความและคำแนะนำสามารถปรับขนาดได้ หากกราฟมีขนาดเล็กเกินไป ให้ลากขอบเพื่อขยายให้ใหญ่ขึ้น
แบบฝึกหัดนี้เป็นส่วนหนึ่งของหลักสูตร
เทคนิคทางสถิติใน Tableau
แบบฝึกหัดเชิงโต้ตอบแบบลงมือทำจริง
เปลี่ยนทฤษฎีให้เป็นการลงมือทำด้วยแบบฝึกหัดเชิงโต้ตอบหนึ่งในของเรา
 เริ่มแบบฝึกหัด