Less is sometimes more
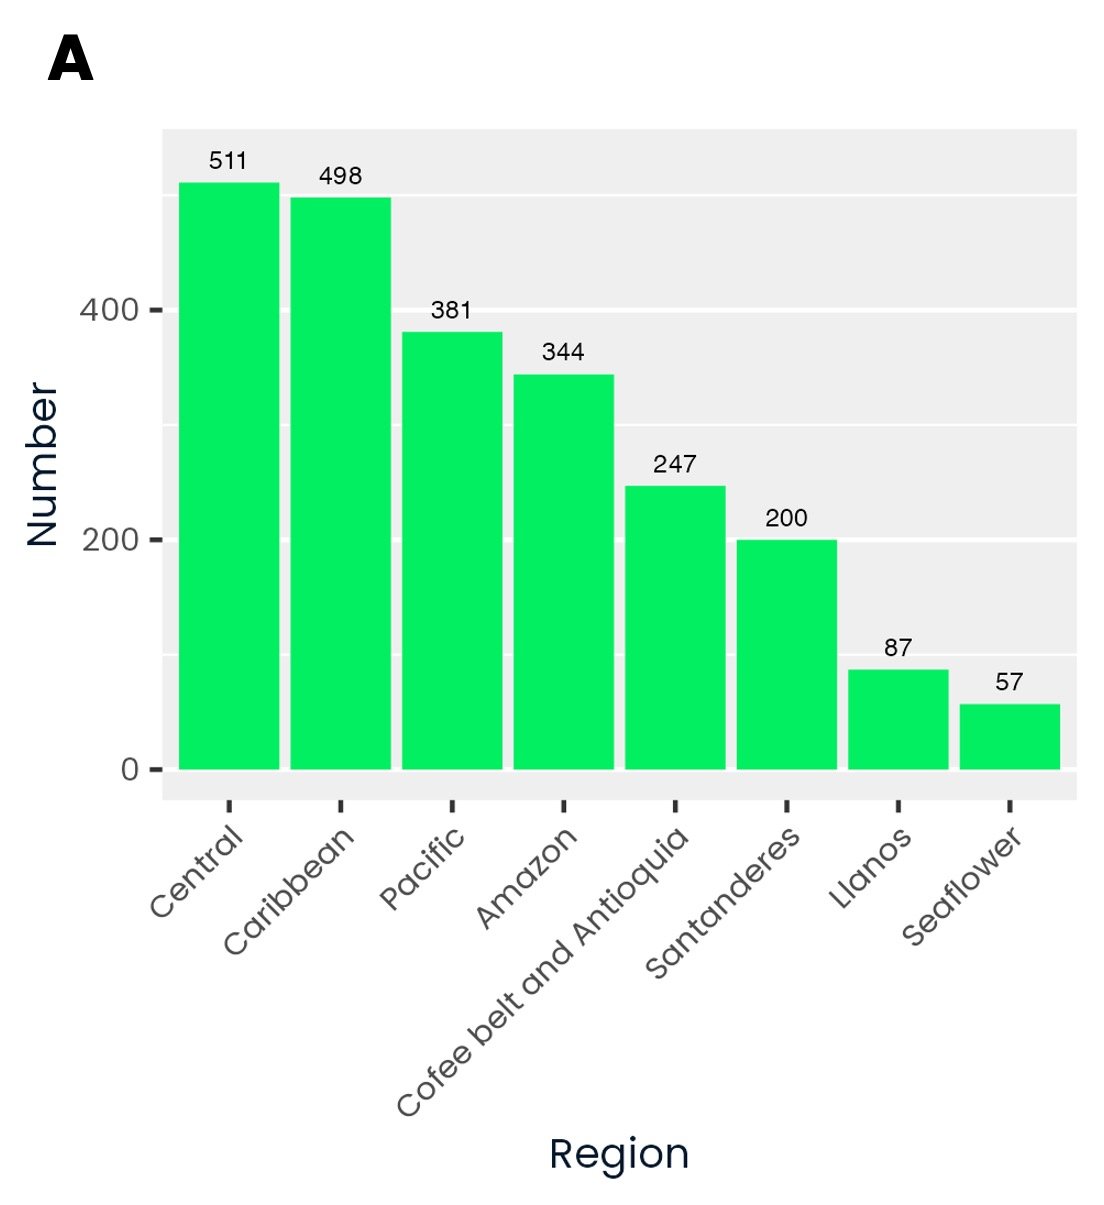
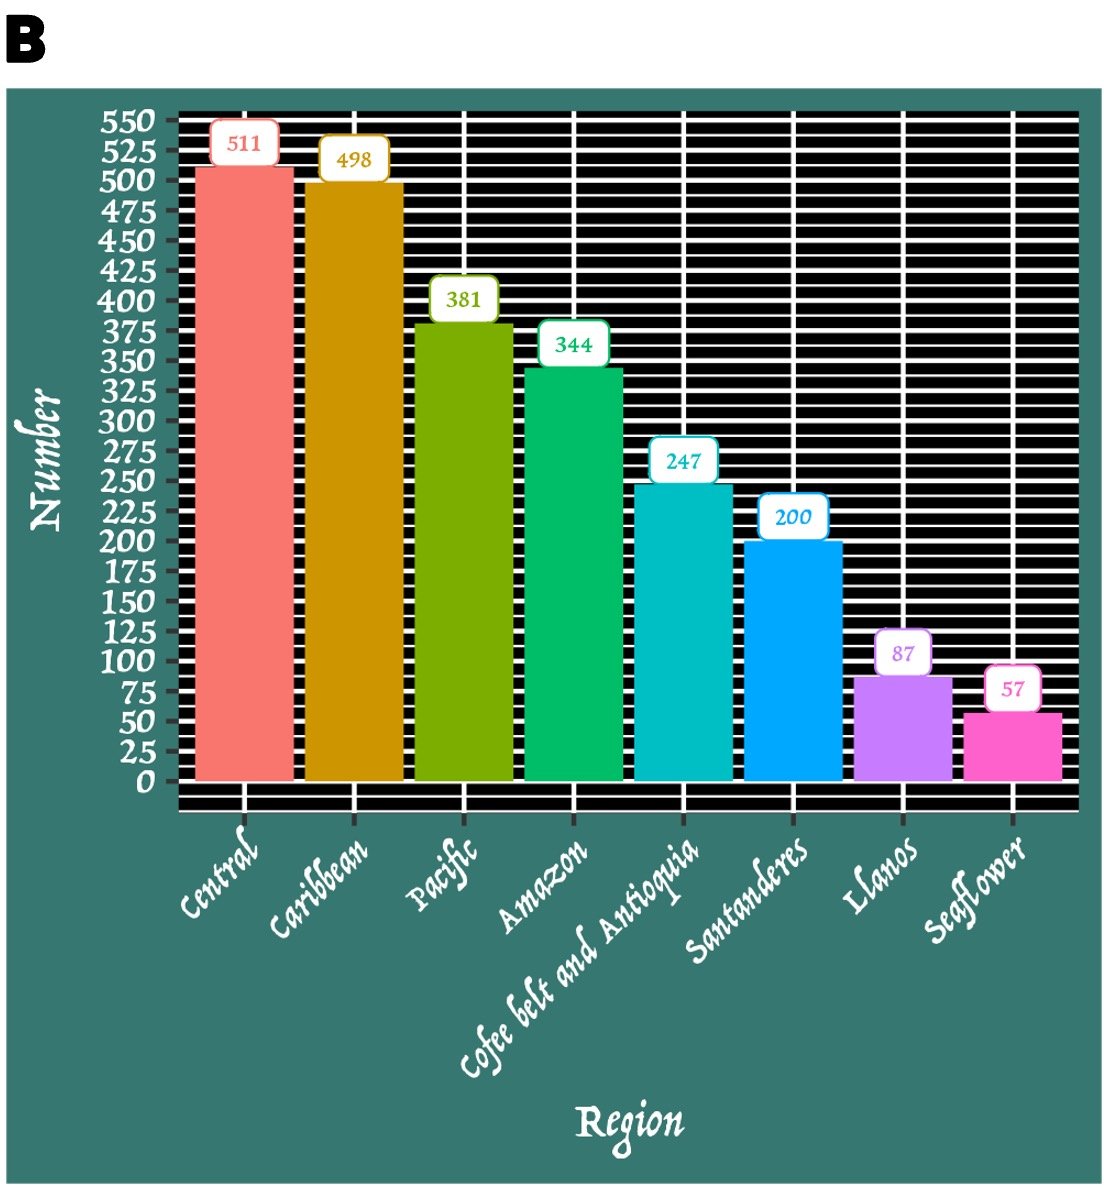
Sometimes, less is more when it comes to data storytelling.
Too much information can make it difficult for the audience to understand the story being told. We'll look into some good practices for creating plots in the following exercises.
For now, take a look into these plots and select the INCORRECT option from the ones below.
แบบฝึกหัดนี้เป็นส่วนหนึ่งของหลักสูตร
Data Storytelling Case Study: Green Businesses
แบบฝึกหัดเชิงโต้ตอบแบบลงมือทำจริง
เปลี่ยนทฤษฎีให้เป็นการลงมือทำด้วยแบบฝึกหัดเชิงโต้ตอบหนึ่งในของเรา
 เริ่มแบบฝึกหัด