Tolka histogram
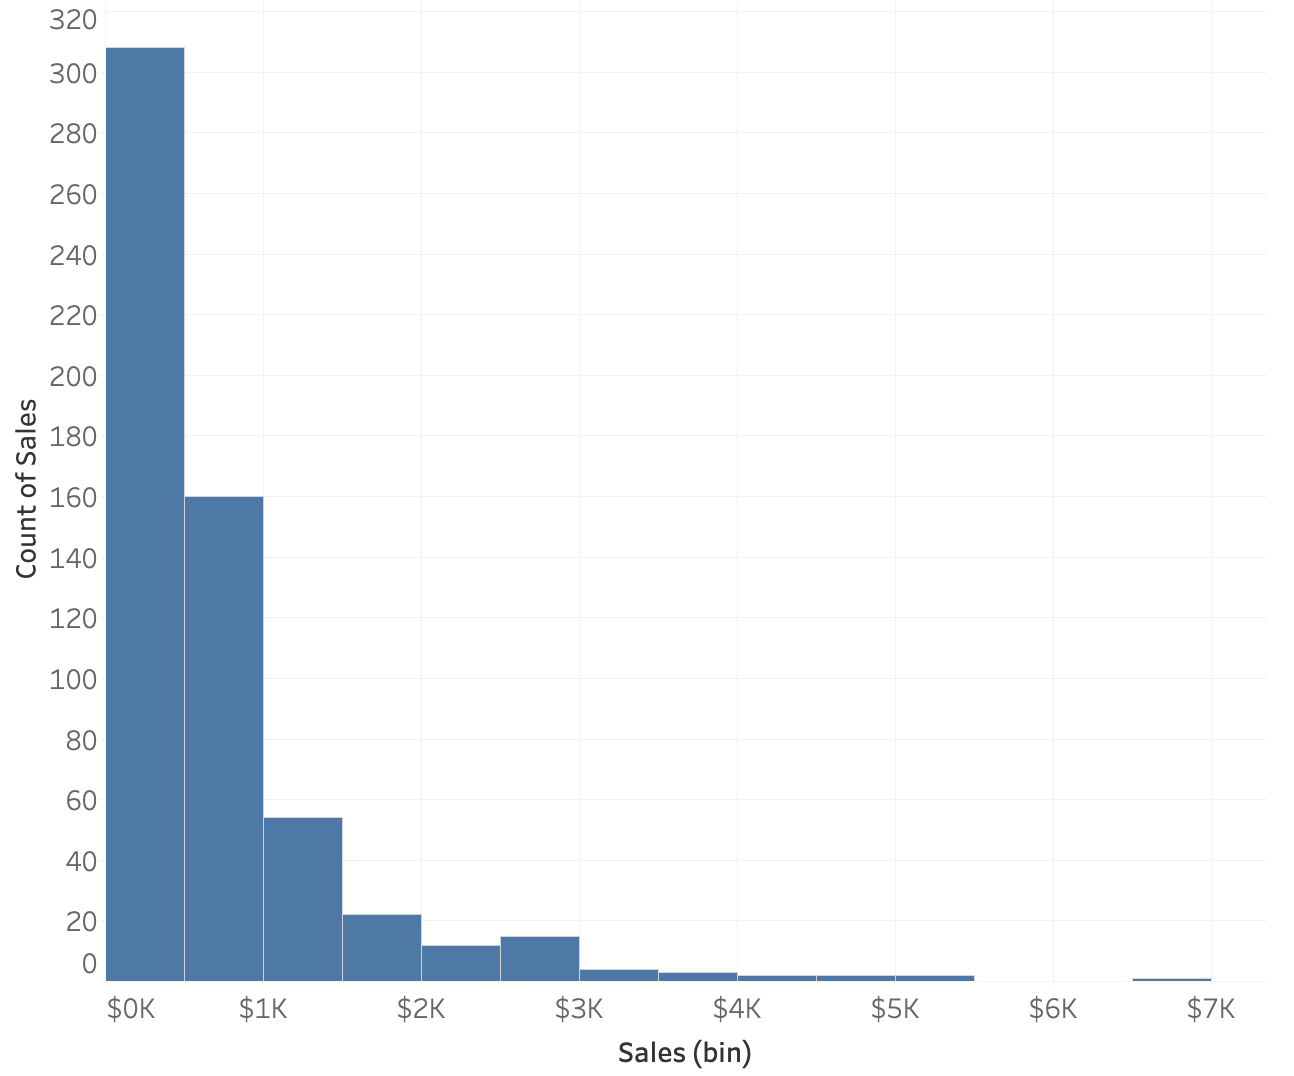
Här är ett histogram över försäljning av kontorsmaterielbeställningar. Varje rad i datamängden representerar en beställning, så varje beställning har ett försäljningsvärde.
Tips: Den vänstra panelen i övningen som innehåller text och instruktioner går att ändra storlek på. Om diagrammet är för litet för att se tydligt kan du dra i kanten för att göra det större.
Den här övningen är en del av kursen
Statistiska tekniker i Tableau
Interaktiv övning med praktiskt arbete
Gör teori till handling med en av våra interaktiva övningar
 Starta övningen