Interpreting dendrogram
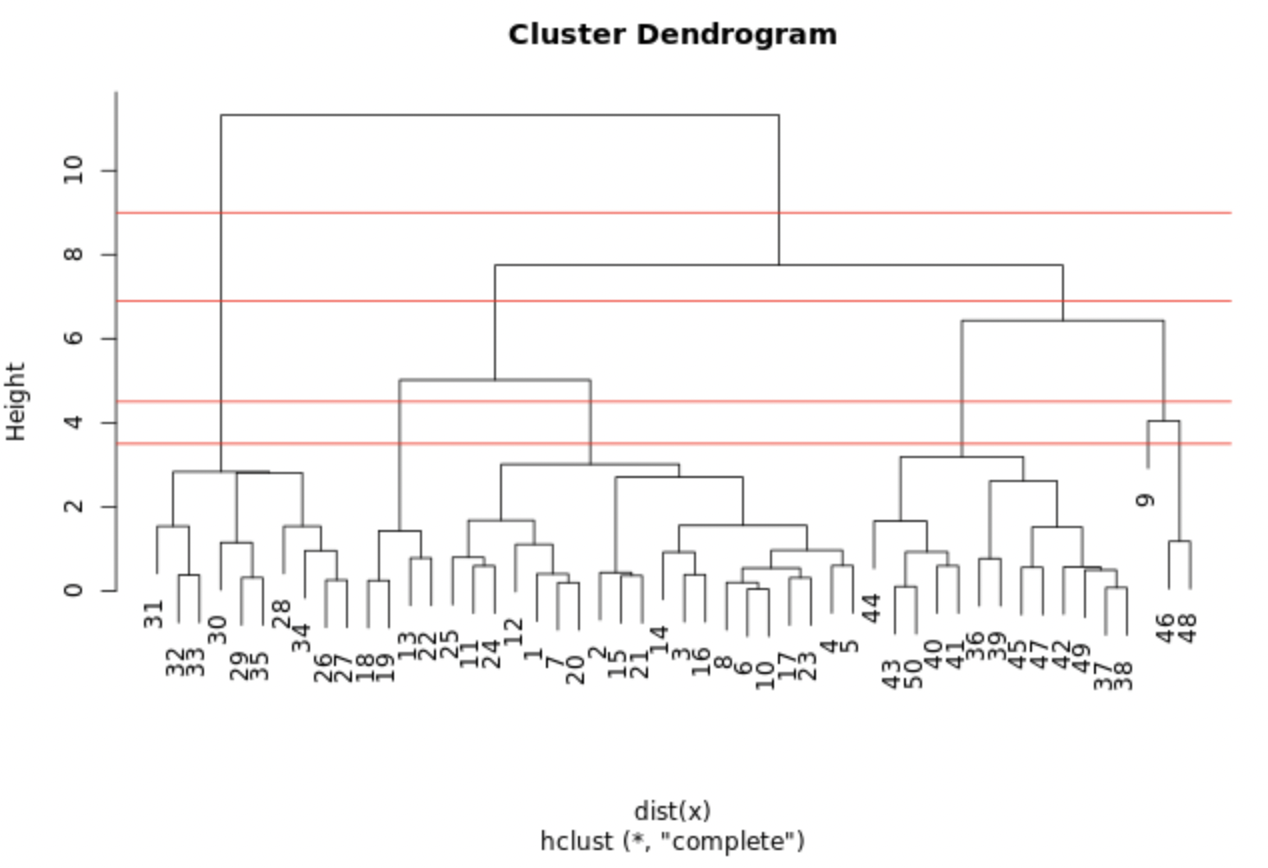
The plot displayed shows the hclust.out model you constructed in the previous exercise. We've drawn horizontal lines at heights of 3.5, 4.5, 6.9, and 9.0, respectively.
Which cut point yields 3 clusters?
Это упражнение является частью курса
Unsupervised Learning in R
Практическое интерактивное упражнение
Превратите теорию в практику с помощью одного из наших интерактивных упражнений
 Начать упражнение