Interpretando histogramas
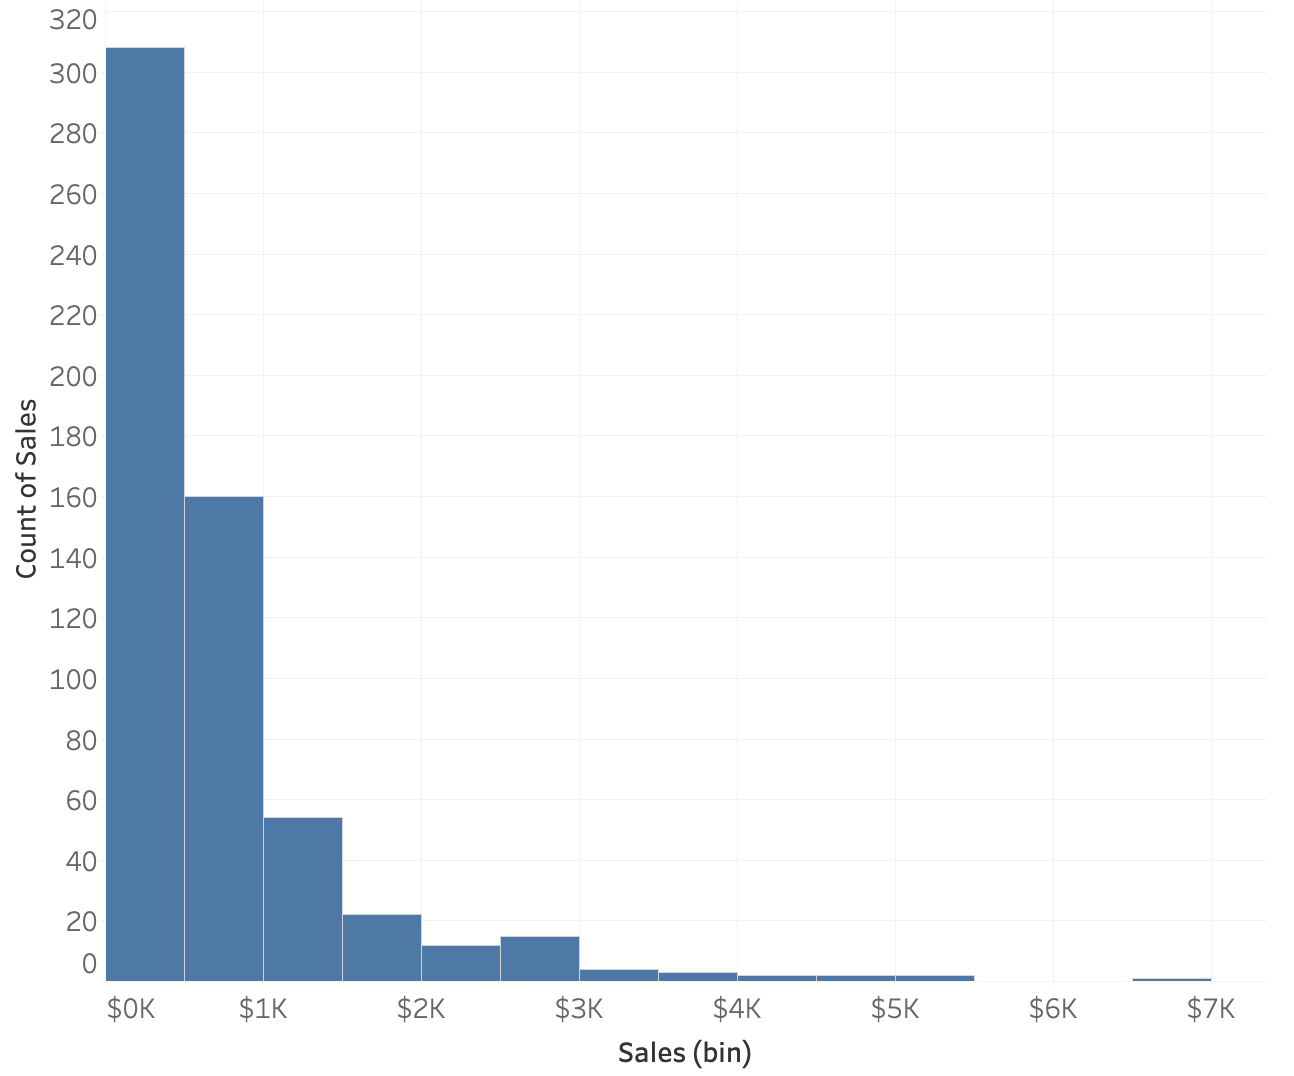
Aqui está um histograma das vendas de pedidos de materiais de escritório. Cada linha do conjunto de dados representa um pedido, então cada pedido tem um valor de venda.
Dica: Este painel à esquerda do exercício, com o texto e as instruções, pode ser redimensionado. Se o gráfico estiver pequeno demais para ver com clareza, você pode arrastar para aumentá-lo.
Este exercicio faz parte do curso
Técnicas estatísticas no Tableau
exercicio interativo prático
Transforme teoria em prática com um dos nossos exercicio interativos
 Iniciar exercicio