Uso de cor
A cor é um dos atributos mais utilizados em visualização de dados.
Não é coincidência que muitas organizações tenham manuais com padrões de uso de cores para seguir sua identidade visual e também por motivos de acessibilidade.
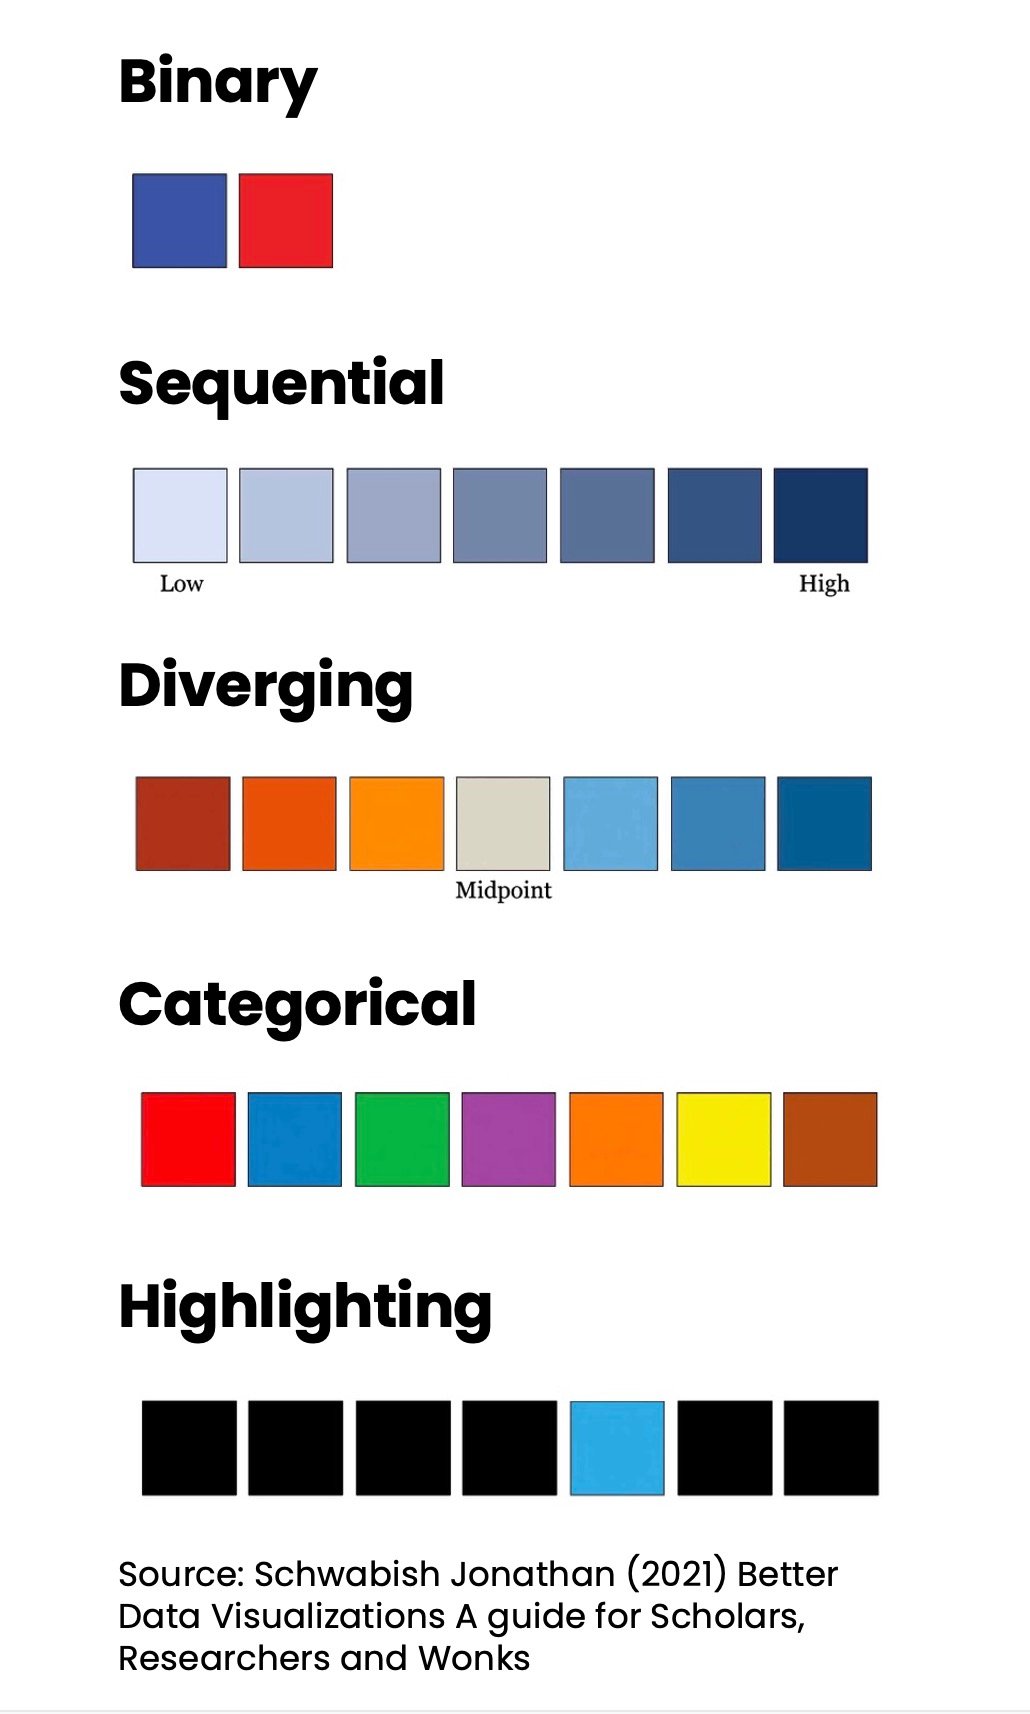
Cinco esquemas principais de cores podem ser aplicados às suas visualizações:
Este exercicio faz parte do curso
Estudo de Caso de Data Storytelling: Negócios Verdes
exercicio interativo prático
Transforme teoria em prática com um dos nossos exercicio interativos
 Iniciar exercicio