Setting colors
Apart from color-coded status settings, there are more colors that can be set for objects like valueBox() and infoBox().
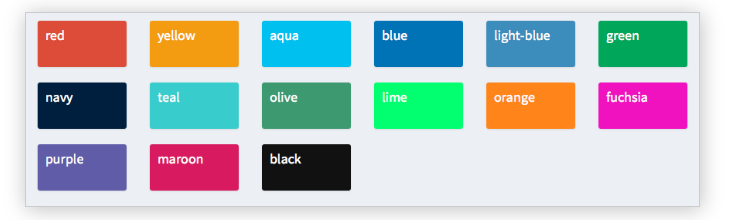
In the following, you will set different colors in the body of a shinydashboard, although these objects can also be defined in the server() as we saw in an earlier example.
In this exercise, the shiny and shinydashboard libraries have already been loaded for you. Furthermore, the header and sidebar have been stored as header and sidebar, and server() is an empty function.
Este exercicio faz parte do curso
Building Dashboards with shinydashboard
exercicio interativo prático
Tente este exercicio completando este código de exemplo.
library(shiny)
library(shinydashboard)

header <- dashboardHeader(
  title = "Portfolio dashboard for Sally",
  titleWidth = 300,
  dropdownMenu(type = "notifications",
       notificationItem("Sell alert", status = "danger"),
       notificationItem("Buy alert", status = "success"))
)

sidebar <- dashboardSidebar(
  width = 300,
  sidebarMenu(
    id = "pages",
    menuItem("Historical trends",
             tabName = "historical"),
    menuItem("Profits and Losses (PnLs)",
             tabName = "profit",
             icon = icon("money-bill-alt"),
             badgeLabel = "+2.3%", badgeColor = "green")
  )
)

body <- dashboardBody(tabItems(
  tabItem(tabName = "historical",
          fluidRow(box(selectInput("stock", "Select stock symbol",
                                   choices=c("AAPL", "DIS"))),
                   box("Stock name",
                       title="Stock name title",
                       width = 6,
                       status = "info", solidHeader = TRUE)),
          # Set the color of each infoBox to black
          fluidRow(infoBox("Open", "value", width = 2, color = ___),
                   infoBox("High", "value", width = 2,___),
                   infoBox("Low", "value", width = 2, ___),
                   infoBox("Close", "value", width = 2, ___),
                   # Set the color of the last infoBox to navy and set its width to 4
                   infoBox("Volume", "value", ___)),
          fluidRow(valueBox("Open (%)", "0%", width = 2),
                   valueBox("High (%)", "+1%", width = 2),
                   valueBox("Low (%)", "-4%", width = 2),
                   valueBox("Close (%)", "-2%", width = 2),
                   valueBox("Volume (%)", "+30%", width = 2)),
          fluidRow(box("Candlestick chart", width = 12, height = 350)),
          fluidRow(box("Volume chart", width = 12, height = 200))),
  tabItem(tabName = "profit",
          fluidRow(box("valueBox", "Account balance", width = 3),
                   box("valueBox",  "Value at Risk (Var)", width = 3),
                   box("valueBox", "Returns", width = 3),
                   box("valueBox", "Profit-to-loss ratio", width = 3)),
          fluidRow(box("PnL chart", width = 12, height = 400)))
)
)

ui <- dashboardPage(header, sidebar, body)
server <- function(input, output){}
shinyApp(ui, server)