Technieken voor afwijkingen
Zoals je in de video’s hebt gezien, zijn er meerdere manieren om afwijkende waarden te identificeren.
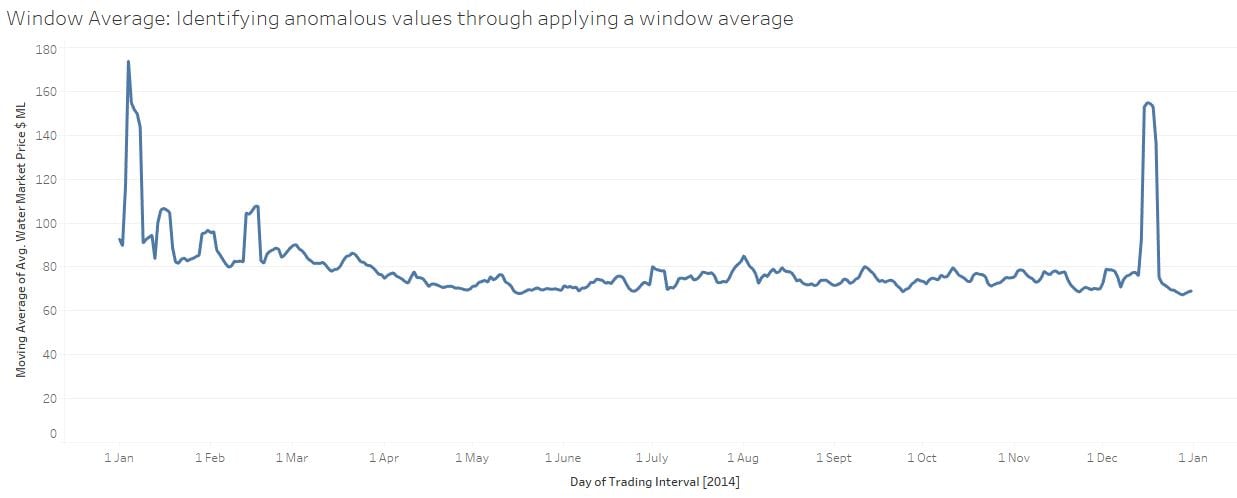
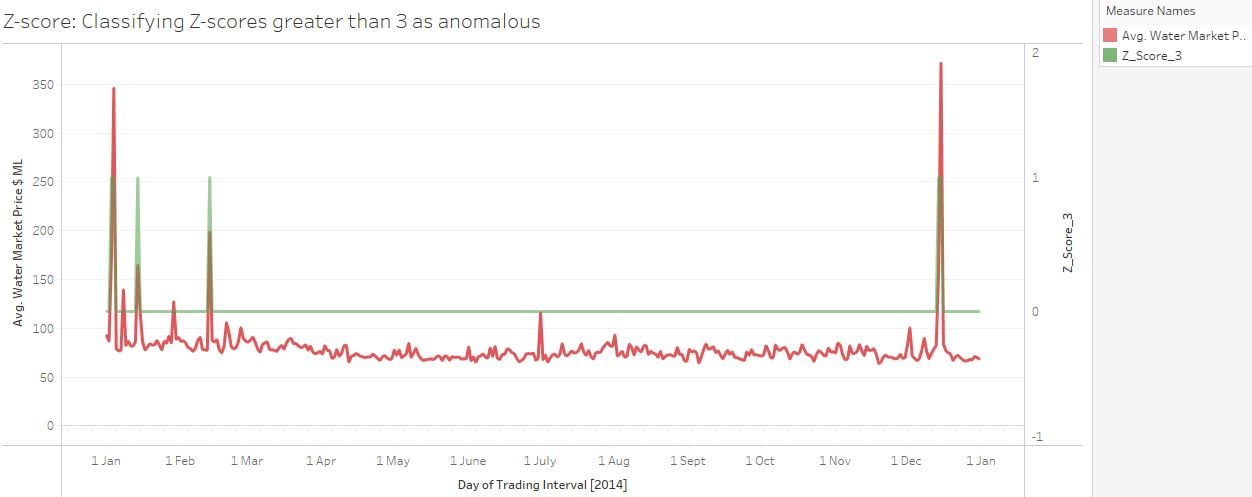
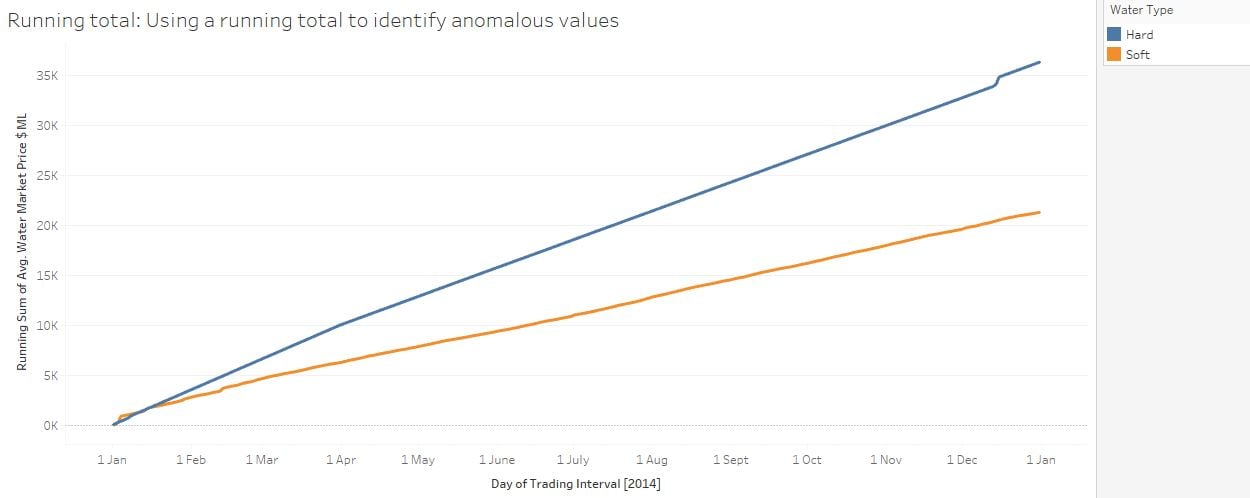
We hebben een reeks visualisaties gemaakt die technieken voor het herkennen van anomalieën laten zien.
Welke van de onderstaande is geen geldige techniek om afwijkende waarden te identificeren?
Bekijk de visuals hieronder!
Deze oefening maakt deel uit van de cursus
Tijdreeksanalyse in Tableau
Interactieve oefening met praktijkervaring
Zet theorie om in actie met een van onze interactieve oefeningen
 Begin oefening