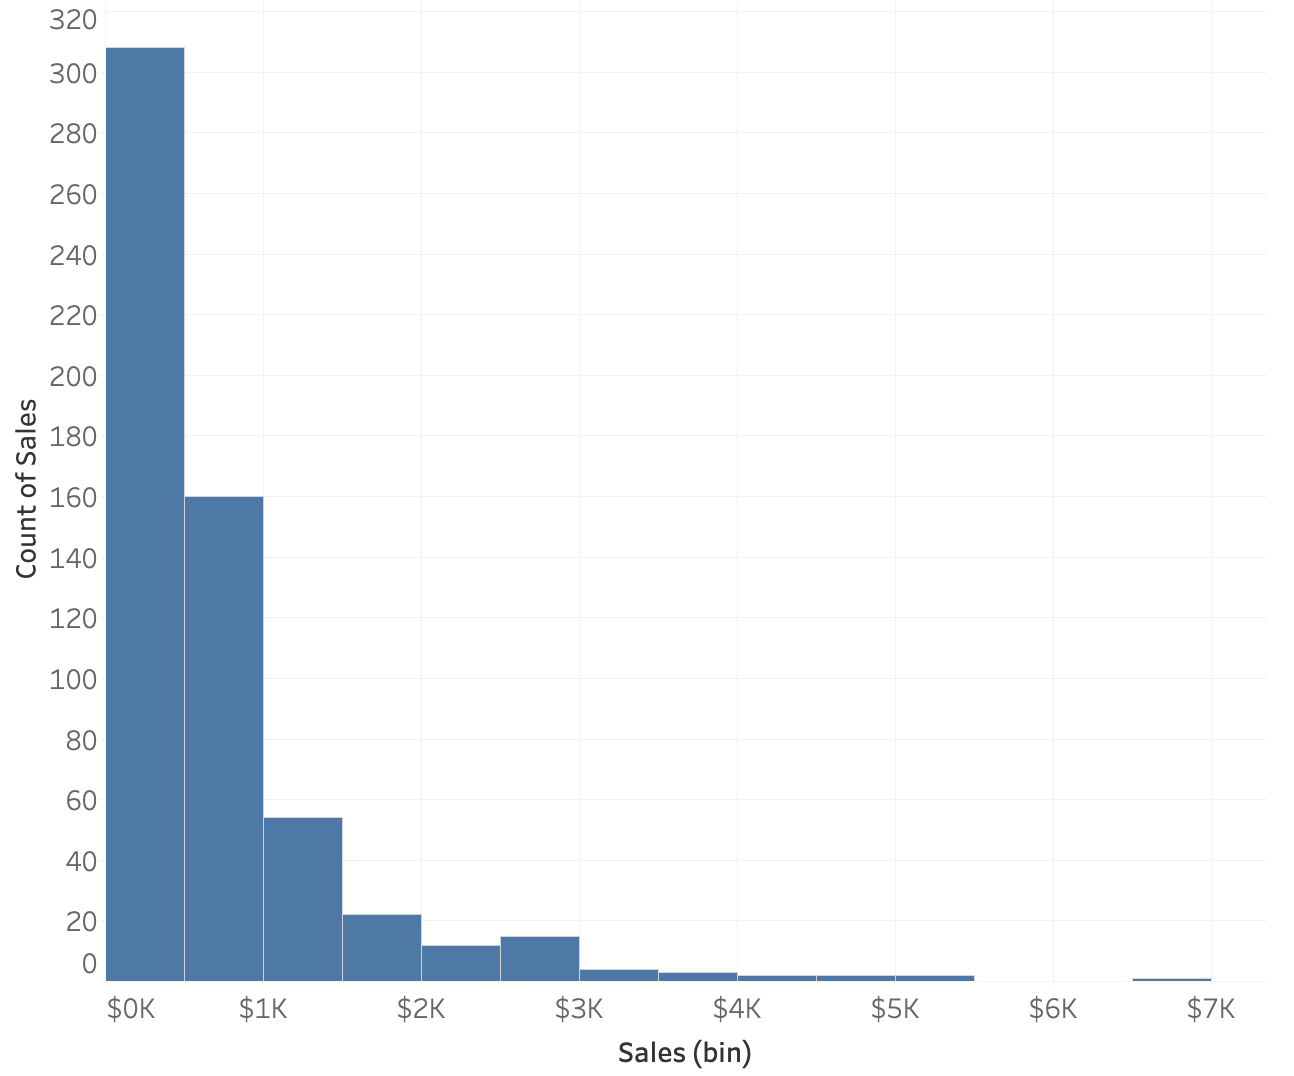
Histogrammen interpreteren
Hier zie je een histogram van verkopen uit bestellingen van kantoorartikelen. Elke rij in de gegevensset staat voor één bestelling, dus elke bestelling heeft één verkoopwaarde.
Tip: Dit linkerpaneel van de oefening met tekst en instructies is formaat aanpasbaar. Is de plot te klein? Sleep dan om hem groter te maken.
Deze oefening maakt deel uit van de cursus
Statistische technieken in Tableau
Interactieve oefening met praktijkervaring
Zet theorie om in actie met een van onze interactieve oefeningen
 Begin oefening