Kernbommen per land
Je krijgt een versie van de Nuclear Explosion DataBase (NEDB) waarin landnamen in de kolomkoppen staan (nuke_df). Je wilt visualiseren hoeveel kernbommen er per jaar per land tot ontploffing zijn gebracht. Daarvoor moet je de data eerst pivoteren en NA-waarden vervangen.
Het pakket ggplot2 is alvast voor je geladen.
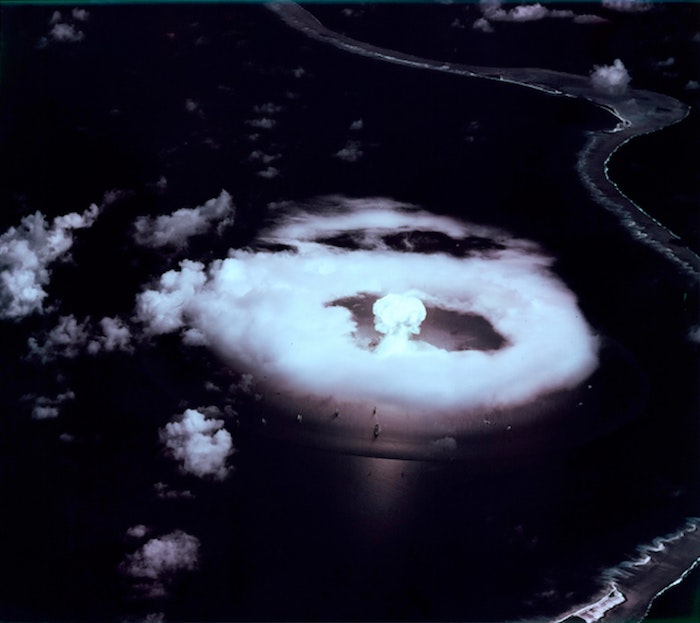
"A-Day" Eerste atoomexplosie bij Bikini in de Marshalleilanden, 1 juli 1946.
Deze oefening maakt deel uit van de cursus
Data herstructureren met tidyr
Interactieve oefening met praktijkervaring
Probeer deze oefening door deze voorbeeldcode aan te vullen.
nuke_df %>%
  # Pivot the data to a longer format
  ___