Aan de slag als data-gedreven marketeer
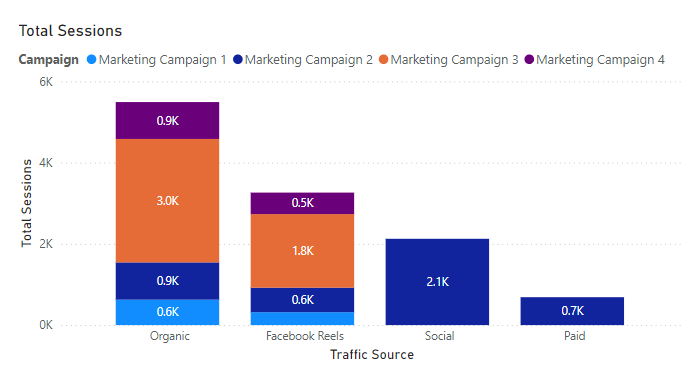
Tijdens je analyse om het websiteverkeer voor een nieuwe marketingcampagne over verschillende kanalen (organische zoekresultaten, socialmedia-advertenties en e-mailmarketing) te beoordelen, heb je een staafdiagram in een Power BI-rapport dat het websiteverkeer per bron (organisch, social media, betaalde advertenties) voor de afgelopen maand laat zien.
Welke TWEE van de volgende elementen KUNNEN nuttig zijn om de algemene verkeerstrends te begrijpen wanneer je deze grafiek bekijkt?
Deze oefening maakt deel uit van de cursus
Power BI voor eindgebruikers
Interactieve oefening met praktijkervaring
Zet theorie om in actie met een van onze interactieve oefeningen
 Begin oefening