Best practices voor visualisaties
Laten we je kennis en begrip testen van de best practices die je moet volgen bij het kiezen van de juiste visual voor je rapport.
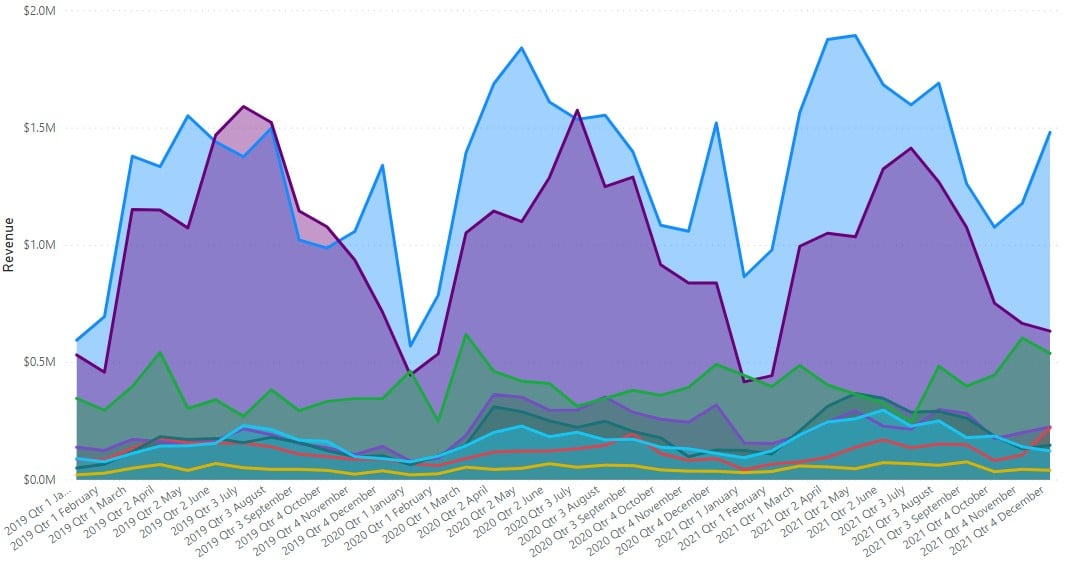
Welke visualisatie past beter bij de onderstaande afbeelding in plaats van een area chart?
Deze oefening maakt deel uit van de cursus
Casestudy: Concurrentieverkoopanalyse in Power BI
Interactieve oefening met praktijkervaring
Zet theorie om in actie met een van onze interactieve oefeningen
 Begin oefening