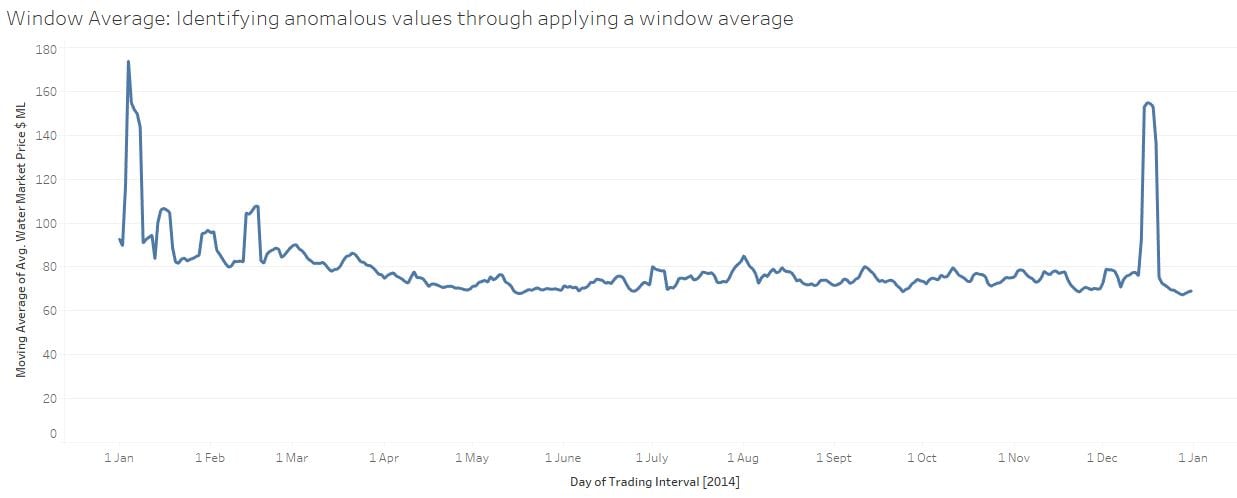
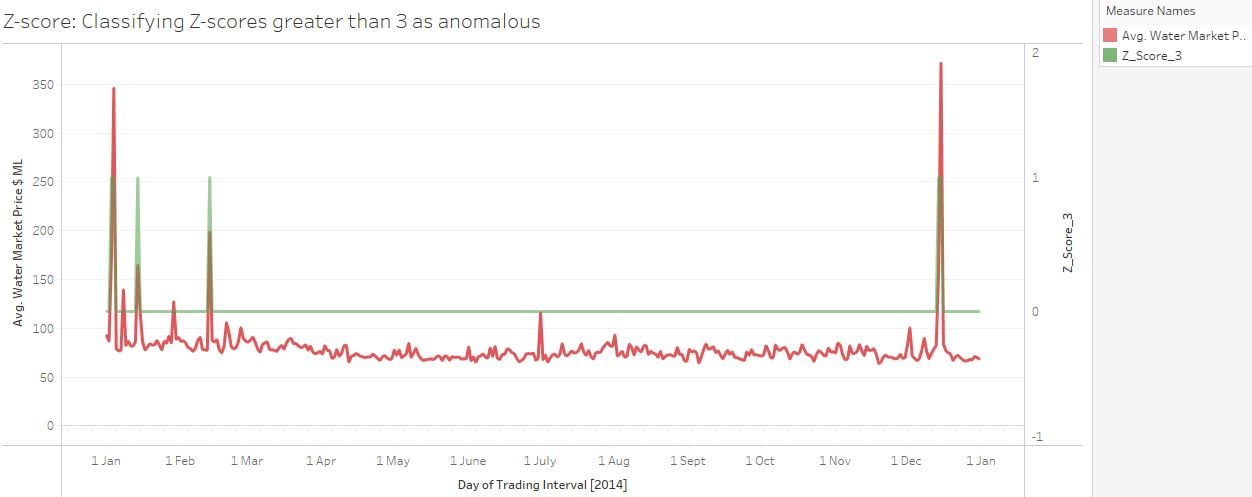
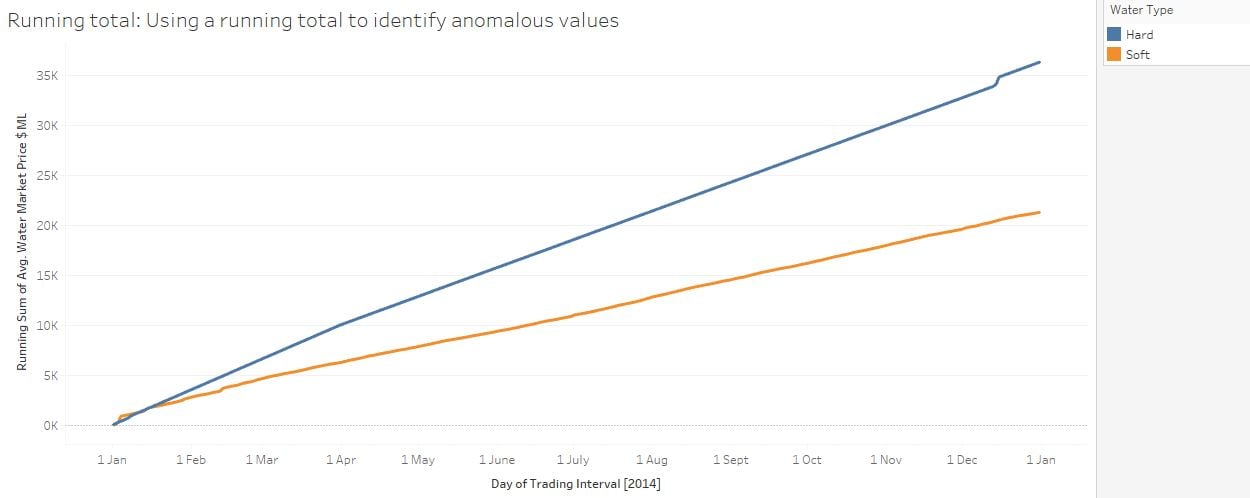
動画で見たとおり、異常値を特定する方法はいくつもあります。
ここでは、異常検知の手法を示しうる一連の可視化を用意しました。
次のうち、異常値を特定する手法として有効ではないものはどれですか?
以下の可視化をご覧ください。
この演習はコースの一部です
理論を実践に変える、インタラクティブな演習のひとつをお試しください
この章では、まず存在するさまざまな時系列のタイプと、それを分析するための手法を理解するところから始めます。基礎概念を押さえたうえで、単変量および多変量の可視化に向けて、時系列データの整形方法を学びます。
誰もがデータを分析したいと思いますが、重要なのはデータがクリーンであることです。この章では、Tableauに備わっている日付関数を使って時系列データをクレンジングし、関心のある時間的な文脈にあわせてデータの形を変え、分割し、再結合する方法を学びます。さらに、季節性、トレンド分析、異常検知の概念にも踏み込みます。
現在の演習
最終章では、ウィンドウ関数の活用とZ値のような統計手法を学び、トレーディング企業における最適なプライシングの裁定機会を見つけるための独自の異常分類器を作成します。章の後半では、複数の異常検知手法を比較し、時系列の取り扱いと分析に幅広く対応できるようにします。