Impostare i colori
Oltre alle impostazioni di status con codifica a colori, ci sono altri colori che puoi impostare per oggetti come valueBox() e infoBox().
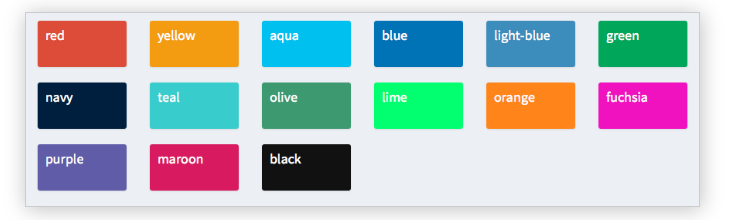
Nel seguito, imposterai colori diversi nel body di uno shinydashboard, anche se questi oggetti possono essere definiti anche nel server() come visto in un esempio precedente.
In questo esercizio, le librerie shiny e shinydashboard sono già state caricate per te. Inoltre, l'header e la sidebar sono stati salvati come header e sidebar, e server() è una funzione vuota.
Questo esercizio fa parte del corso
Creare dashboard con shinydashboard
esercizio interattivo pratico
Prova questo esercizio completando questo codice di esempio.
library(shiny)
library(shinydashboard)

header <- dashboardHeader(
  title = "Portfolio dashboard for Sally",
  titleWidth = 300,
  dropdownMenu(type = "notifications",
       notificationItem("Sell alert", status = "danger"),
       notificationItem("Buy alert", status = "success"))
)

sidebar <- dashboardSidebar(
  width = 300,
  sidebarMenu(
    id = "pages",
    menuItem("Historical trends",
             tabName = "historical"),
    menuItem("Profits and Losses (PnLs)",
             tabName = "profit",
             icon = icon("money-bill-alt"),
             badgeLabel = "+2.3%", badgeColor = "green")
  )
)

body <- dashboardBody(tabItems(
  tabItem(tabName = "historical",
          fluidRow(box(selectInput("stock", "Select stock symbol",
                                   choices=c("AAPL", "DIS"))),
                   box("Stock name",
                       title="Stock name title",
                       width = 6,
                       status = "info", solidHeader = TRUE)),
          # Set the color of each infoBox to black
          fluidRow(infoBox("Open", "value", width = 2, color = ___),
                   infoBox("High", "value", width = 2,___),
                   infoBox("Low", "value", width = 2, ___),
                   infoBox("Close", "value", width = 2, ___),
                   # Set the color of the last infoBox to navy and set its width to 4
                   infoBox("Volume", "value", ___)),
          fluidRow(valueBox("Open (%)", "0%", width = 2),
                   valueBox("High (%)", "+1%", width = 2),
                   valueBox("Low (%)", "-4%", width = 2),
                   valueBox("Close (%)", "-2%", width = 2),
                   valueBox("Volume (%)", "+30%", width = 2)),
          fluidRow(box("Candlestick chart", width = 12, height = 350)),
          fluidRow(box("Volume chart", width = 12, height = 200))),
  tabItem(tabName = "profit",
          fluidRow(box("valueBox", "Account balance", width = 3),
                   box("valueBox",  "Value at Risk (Var)", width = 3),
                   box("valueBox", "Returns", width = 3),
                   box("valueBox", "Profit-to-loss ratio", width = 3)),
          fluidRow(box("PnL chart", width = 12, height = 400)))
)
)

ui <- dashboardPage(header, sidebar, body)
server <- function(input, output){}
shinyApp(ui, server)